Читайте также:
|
You can gain additional flexibility by defining functions. Here’s how to add a function definition to your worksheet:
1.First delete the table. To do so, drag-select the entire region until you’ve enclosed everything between the two editing lines. Then choose Cut from the Edit menu (keystroke: [Ctrl] X) or click  on the Standard toolbar.
2.Now define the function d(t) by typing d(t): 
3.Complete the definition by typing this expression:
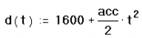
The definition you just typed defines a function. The function name is d, and the argument of the function is t. You can use this function to evaluate the above expression for different values of t. To do so, simply replace t with an appropriate number.
Formatting a Result
You can set the display format for any number Mathcad calculates and displays. This means changing the number of decimal places shown, changing exponential notation to ordinary decimal notation, and so on.
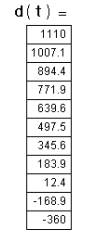
For example, in the example above, the first two values,  and
and  , are in exponential (powers of 10) notation. Here’s how to change the table produced
above so that none of the numbers in it are displayed in exponential notation:
1.Click anywhere on the table with the mouse.
2.Choose Result from the Format menu. You see the Result Format dialog box. This box contains settings that affect how results are displayed, including the number of decimal places, the use of exponential notation, the radix, and so on.
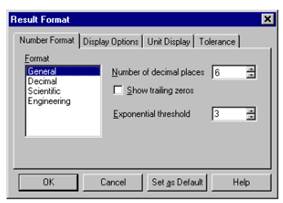
3.The default format scheme is General which has Exponential Threshold set to 3. This means that only numbers greater than or equal to are displayed in exponential notation. Click the arrows to the right of the 3 to increase the Exponential Threshold to 6.
4.Click “OK.” The table changes to reflect the new result format.
Graphs
Mathcad can show both two-dimensional Cartesian and polar graphs, contour plots, surface plots, and a variety of other three-dimensional graphs. These are all examples of graph regions.
This section describes how to create a simple two-dimensional graph showing the points calculated in the previous section.
Дата добавления: 2015-10-26; просмотров: 141 | Нарушение авторских прав
| <== предыдущая страница | | | следующая страница ==> |
| A Simple Calculation | | | Creating a vector or matrix |