Читайте также:
|
|
|
|
 To get proper curve proper values should be used. To make a curve with one point of inflection, one maxima and one minima with a shift along the x-axis, both
  and
and  fractions need to have the same shift, otherwise the curve of the subtraction of the functions will not have a proper shape (Figure 26)
|
 f(x)=
f(x)= 
|
 functions have different stationary point values, they do not match so the curve of their sum has no point of inflection when f(x)= values take f(x)=
  values
|
f(x)= 
|
|
To add a cusp curve to the
f(x)= function the cusp curve should have the same shift along the x-axis because the cusp and the point of inflection should coincide with each other or cusp needs to coincide with any point of the other curve to create a cusp in a new curve
All functions can be modified in different cases, but in the situation when I want to get a cusp, and at least some other clear points I will create a cusp in the middle and use a normal cusp curve f(x)=  to clearly outline newly created stationary points.
|
and f(x)=  will be combined by subtraction
|
 f(x)=
f(x)= 
|
|
f(x)= 

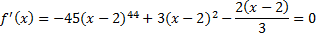
X= 2
X=1.0577
X= 2.2222
X= 2.93149
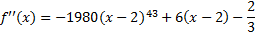
-  (2) = - 2/3 (local max)
- (1.0577)= 147.4243 (local min)
- (2.2222)= 0.6665 (local min)
- (2.93149)= -88.68889 (local max)
At x=2 the curve has a cusp, and at x=1.0577 (local min), x=2.2222 (local min), x=2.93149 (local max)
(Complex calculations were made at http://www.wolframalpha.com/)
Question 5
Gumnut gallery
This report will investigate the distance viewers should be advised to stand away from a wall on which paintings are hung in order to optimise their viewing angle
|
 Figure 29 has a sketch of few patterns:
x - is a distance between person and painting
h – is a height of the eye level of the person
L – as a height placement of the painting on the wall
Дата добавления: 2015-10-29; просмотров: 193 | Нарушение авторских прав
| <== предыдущая страница | | | следующая страница ==> |
| Иванов Иван Иванович | | | L – is a difference between h and L |


