Читайте также:
|
Laboratory work 6
Bases of working in MS Excel
Task
Step 1
Step2
Step 3
Step 4
Step 5
Step 6
Laboratory work 7
Solver
Tasks:
1. Preset initial values in the Excel like in the following picture.
2. Try to fit the quantity of food proceeding from criteria “Minimal price”. Account the day needs of humans – amount of kilocalories, proteins, fats and carbohydrates must be not less than day needs.
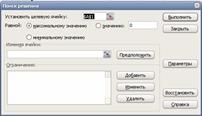
3. Do the same, but use solver. (Could be found in page “Data” in MS Office 2007. If it is not installed you can install it in the following way: button Office->Параметры Excel->Надстройки-> in the bottom of the page Управление: надстройки Excel -> Перейти-> choose Поиск решения->ОК)
4. Do the same as in item 3, but criteria have to be “Minimal calories”.
5. Do the same as in item 3, but change the limitation “>=” to “=”.
6. Find the amount of foods which will satisfy the daily humans’ needs using the “Least squares method”.
Laboratory work 8
Arrays and matrix in Excel
Task
1. Copy 3 lines of the table from Laboratory work 7.
2. Find the content of kilocalories in 100 g of proteins, fats and carbohydrates, basing of 3 types of foods. Construct SLAE for solving. Do this by 3 ways:
- using inverse matrix,
- determinants of matrix
- Solver.
Note: While calculating the matrices push not OK, but ctrl+shift+OK because of the working with arrays.
Laboratory work 9
Normal Distribution
Task
1. Study the theory of normal distribution.
2. Using parameters from Table 1 enter the statistics of foot-sizes in Microsoft Excel.
- Write all sizes in the next column
- Calculate mean value and deviation of foot-sizes
- Calculate the frequency of arising of each foot-size in percents
- For each frequency calculate its value of normal distribution
- Calculate the marginal change of normal distribution of foot-size in percents
- Calculate how much pairs of each foot size should be made, if their total sum is equal to 1,000,000
- Using the given parameters, draw the diagram of normal distribution
3. Answer the control questions
Methodological Guide
To calculate mean value of foot-size such Microsoft Excel formula may be used:
<mean value> =СРЗНАЧ(<array of statistics of foot-sizes>) (1)
To calculate the standard deviation such Microsoft Excel formula may be used:
<standard deviation>=СТАНДОТКЛОН(<array of statistics of foot-sizes>;<mean value>) (2)
Frequency of arising of each foot-size may be calculated with the help of next formula:
<frequency>=ЧАСТОТА(<array of statistics of foot-sizes>;<array of all foot-sizes>)/<number of items used in the statistics> (3)
Note: Don’t forget that this formula works with arrays, so after inputting it in a formula line you should press Ctrl+Shift+Enter.
Marginal Change of normal distribution should be calculated by the formula
<marginal change>=<normal distribution2> - normal distribution1> (4)
Normal Distribution may be calculated by the formula:
<normal distribution>=НОРМРАСП(<frequency>;<mean value>;<standard deviation>;<logic value>) (5)
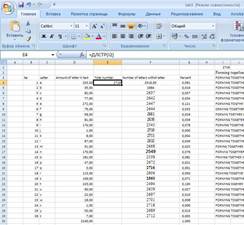
1. Enter foot-sizes statistics in a column as shown in a picture:
2. Write all sizes in the next column:
3. Calculate the frequency of arising of each foot-size in percents with the help of formula (3)
4. Calculate the mean value of foot sizes with the help of formula (1)
5. Calculate standard deviation of foot-sizes with the help of formula (2)
6. Calculate normal distribution with the help of formula (5)
7. Calculate the marginal change of normal distribution of foot-size in percents with the help of formula (4)
8. Calculate how much pairs of each foot size should be made, if their total sum is equal to 1,000,000
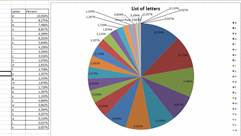
9. Using the given parameters, draw the diagram of normal distribution
Дата добавления: 2015-10-26; просмотров: 118 | Нарушение авторских прав
| <== предыдущая страница | | | следующая страница ==> |
| Work procedure | | | Граничные условия |