Читайте также:
|
1. Holding-period returns for Market, Reynolds Computer, and Andrews
Market Reynolds Computer Andrews
Price kt (kt-  )2 Price kt (kt- )2 Price kt (kt- )2
| May | 1090.82 | 20.60 | 24.00 | ||||||||||
| June | 1133.84 | 3.94% | 0.0007 | 23.20 | 12.62% | 0.0067 | 26.72 | 11.33% | 0.0065 | ||||
| July | 1120.67 | -1.16% | 0.0006 | 27.15 | 17.03% | 0.0158 | 20.94 | -21.63% | 0.0619 | ||||
| Aug | 957.28 | -14.58% | 0.0251 | 25.00 | -7.92% | 0.0153 | 15.78 | -24.64% | 0.0778 | ||||
| Sept | 1017.01 | 6.24% | 0.0025 | 32.88 | 31.52% | 0.0733 | 18.09 | 14.64% | 0.0130 | ||||
| Oct | 1098.67 | 8.03% | 0.0046 | 32.75 | -0.40% | 0.0023 | 21.69 | 19.90% | 0.0277 | ||||
| Nov | 1163.63 | 5.91% | 0.0022 | 30.41 | -7.15% | 0.0134 | 23.06 | 6.32% | 0.0009 | ||||
| Dec | 1229.23 | 5.64% | 0.0019 | 36.59 | 20.32% | 0.0252 | 28.06 | 21.68% | 0.0340 | ||||
| Jan | 1279.64 | 4.10% | 0.0008 | 50.00 | 36.65% | 0.1037 | 26.03 | -7.23% | 0.0110 | ||||
| Feb | 1238.33 | -3.23% | 0.0020 | 40.06 | -19.88% | 0.0592 | 26.44 | 1.58% | 0.0003 | ||||
| Mar | 1286.37 | 3.88% | 0.0007 | 40.88 | 2.05% | 0.0006 | 28.06 | 6.13% | 0.0008 | ||||
| Apr | 1335.18 | 3.79% | 0.0006 | 41.19 | 0.76% | 0.0014 | 36.94 | 31.65% | 0.0806 | ||||
| May | 1301.84 | -2.50% | 0.0014 | 34.44 | -16.39% | 0.0434 | 36.88 | -0.16% | 0.0012 | ||||
| June | 1372.71 | 5.44% | 0.0018 | 37.00 | 7.43% | 0.0009 | 37.56 | 1.84% | 0.0002 | ||||
| July | 1328.72 | -3.20% | 0.0020 | 40.88 | 10.49% | 0.0037 | 23.25 | -38.10% | 0.1710 | ||||
| Aug | 1320.41 | -0.63% | 0.0004 | 48.81 | 19.40% | 0.0224 | 22.88 | -1.59% | 0.0023 | ||||
| Sept | 1282.71 | -2.86% | 0.0017 | 41.81 | -14.34% | 0.0353 | 24.78 | 8.30% | 0.0026 | ||||
| Oct | 1362.93 | 6.25% | 0.0025 | 40.13 | -4.02% | 0.0072 | 27.19 | 9.73% | 0.0042 | ||||
| Nov | 1388.91 | 1.91% | 0.0000 | 43.00 | 7.15% | 0.0007 | 26.56 | -2.32% | 0.0031 | ||||
| Dec | 1469.25 | 5.78% | 0.0021 | 51.00 | 18.60% | 0.0201 | 24.25 | -8.70% | 0.0143 | ||||
| Jan | 1394.46 | -5.09% | 0.0040 | 38.44 | -24.63% | 0.0845 | 32.00 | 31.96% | 0.0824 | ||||
| Febr | 1366.42 | -2.01% | 0.0011 | 40.81 | 6.17% | 0.0003 | 35.13 | 9.78% | 0.0043 | ||||
| Mar | 1498.58 | 9.67% | 0.0071 | 53.94 | 32.17% | 0.0769 | 44.81 | 27.55% | 0.0591 | ||||
| Apr | 1452.43 | -3.08% | 0.0019 | 50.13 | -7.06% | 0.0132 | 30.23 | -32.54% | 0.1281 | ||||
| May | 1420.60 | -2.19% | 0.0012 | 43.13 | -13.96% | 0.0339 | 34.00 | 12.47% | 0.0085 | ||||
| Sum | 30.07% | .0689 | 106.62% | 77.95% | .7958 | ||||||||
2. Average
Monthly
Return 1.25% 4.44% 3.25%
Standard
Deviation 5.47% 16.93% 18.60%
3.

4 Reynolds’s returns have a great amount of volatility with some correlation to the market returns.
The same can be said of Andrews. The returns show a great amount of volatility that followed the market returns only part of the time.
5. Monthly returns of a portfolio of equal amounts of Reynolds and Andrews.
Monthly
Returns
| June | 11.98% | |
| July | -2.32% | |
| August | -16.27% | |
| September | 23.08% | |
| October | 9.74% | |
| November | -0.41% | |
| December | 21.02% | |
| January | 14.70% | |
| February | -9.16% | |
| March | 4.09% | |
| April | 16.20% | |
| May | -8.28% | |
| June | 4.65% | |
| July | -13.81% | |
| August | 8.90% | |
| September | -3.00% | |
| October | 2.84% | |
| November | 2.43% | |
| December | 4.95% | |
| January | 3.66% | |
| February | 7.97% | |
| March | 29.87% | |
| April | -19.80% | |
| May | -0.75% | |
| Average return | 3.84% | |
| Standard deviation | 12.29% |

6.
We see in this new graph where both stocks are included as a single portfolio that the relationship of the stocks with the market approximates an average of the relationships taken alone. Note the reduction in volatility that occurs when risk is diversified even between just two stocks.
7. Monthly holding-period returns for long-term government bonds
(ki- )2
| June | 5.70% | 0.48% | 0.000000% | |
| July | 5.68% | 0.47% | 0.000001% | |
| August | 5.54% | 0.46% | 0.000004% | |
| September | 5.20% | 0.43% | 0.000023% | |
| October | 5.01% | 0.42% | 0.000041% | |
| November | 5.25% | 0.44% | 0.000020% | |
| December | 5.06% | 0.42% | 0.000036% | |
| January | 5.16% | 0.43% | 0.000027% | |
| February | 5.37% | 0.45% | 0.000012% | |
| March | 5.58% | 0.47% | 0.000003% | |
| April | 5.55% | 0.46% | 0.000004% | |
| May | 5.81% | 0.48% | 0.000000% | |
| June | 6.04% | 0.50% | 0.000005% | |
| July | 5.98% | 0.50% | 0.000003% | |
| August | 6.07% | 0.51% | 0.000006% | |
| September | 6.07% | 0.51% | 0.000006% | |
| October | 6.26% | 0.52% | 0.000016% | |
| November | 6.15% | 0.51% | 0.000009% | |
| December | 6.35% | 0.53% | 0.000022% | |
| January | 6.63% | 0.55% | 0.000050% | |
| February | 6.23% | 0.52% | 0.000014% | |
| March | 6.05% | 0.50% | 0.000005% | |
| April | 5.85% | 0.49% | 0.000000% | |
| May | 6.15% | 0.51% | 0.000009% |
Average
Monthly
Return 0.48%
Standard
Deviation 0.04%
8. Monthly portfolio returns when portfolio consists of equal amounts invested in Reynolds, Andrews, and long-term government bonds.
(ki- )2
| June | 8.14% | 0.0029 | |
| July | -1.39% | 0.0017 | |
| August | -10.69% | 0.0180 | |
| September | 15.53% | 0.0164 | |
| October | 6.63% | 0.0015 | |
| November | -0.13% | 0.0008 | |
| December | 14.15% | 0.0131 | |
| January | 9.94% | 0.0052 | |
| February | -5.95% | 0.0075 | |
| March | 2.88% | 0.0000 | |
| April | 10.95% | 0.0068 | |
| May | -5.36% | 0.0065 | |
| June | 3.27% | 0.0000 | |
| July | -9.04% | 0.0138 | |
| August | 6.10% | 0.0011 | |
| September | -1.83% | 0.0021 | |
| October | 2.07% | 0.0000 | |
| November | 1.79% | 0.0001 | |
| December | 3.48% | 0.0001 | |
| January | 2.63% | 0.0000 | |
| February | 5.49% | 0.0008 | |
| March | 20.08% | 0.0301 | |
| April | -13.04% | 0.0248 | |
| May | -0.33% | 0.0009 | |
| Sum | 65.36% | 0.1542 |
 2.72%
2.72%
Std. Dev.. 8.19%
9. Comparison of average returns and standard deviations
Average Standard
Returns Deviations
Reynolds 4.44% 16.93%
Andrews 3.25% 18.60%
Government security 0.48% 0.04%
Reynolds & Andrews 3.84% 12.29%
Reynolds, Andrews, 2.72% 8.19%
& government security
Market 1.25% 5.47%
From the findings above, we see that higher average returns are associated with higher risk (standard deviations), and that by diversification we can reduce risk, possibly without reducing the average return.
10. Based on the standard deviations, Andrews has more risk than Reynolds, 18.60 percent standard deviation versus 16.93 percent standard deviation. However, when we only consider systematic risk, Andrews is slightly less risky--Reynolds's beta is 1.96 compared to Andrews’ beta of 1.49. (The betas given here for Reynolds and Andrews come from financial services who calculate firms' betas. These are not consistent with the graphs above where we see Andrews' returns as being more responsive to the general market. We are seeing the problem of using only 24 months of returns as we have done.)
11. = + (Market Return - Risk-Free Rate) X Beta
Market Return = 1.25 % Average Monthly Return X 12 Months = 15%.
(The average returns for the market over a two-year period may be high or low relative to the longer-term past, and as a result should not be considered as “typical” investor expectations. For instance, if we used information from Ibbotson & Sinquefield for the years 1926-2002, the market risk premium—market return less risk-free rate—was 8.4 percent, and not the 19 percent that we use below. The point: Do not think two years fairly captures what we can expect in the future?)
Reynolds:
23.64% = 6% + (15% - 6%) X 1.96
Andrews:
19.41% = 6% + (15% - 6%) X 1.49
And if we used the market premium of 8.4 percent:
Reynolds:
22.46% = 6% + 8.4% X 1.96
Andrews:
18.52% = 6% + 8.4% X 1.49
Solutions to Problem Set B
6-1B.
krf =.05 +.07 + (.05 x.07)
krf =.1235
or
12.35% = nominal rate of interest
6-2B.
krf =.03 +.05 + (.03 x.05)
krf =.0815
or
8.15% = nominal rate of interest
6-3B.
(A) (B) (A) x (B) Weighted
Probability Return Expected Return Deviation
P(ki) (ki) (ki- )2P(ki)
.15 -3% -0.45% 4.788
.30 2 0.60 0.127
.40 4 1.60 0.729
.15 6 0.901.683
= 2.65% s2 = 7.327%
s = 2.707%
No, Gautney should not invest in the security. The security’s expected rate of return is less than the rate offered on treasury bills.
6-4B.
Security A:
(A) (B) (A) x (B) Weighted
Probability Return Expected Return Deviation
P(ki) (ki) (ki- )2P(ki)
0.2 - 2% -0.4% 69.19%
0.5 19 9.5 2.88
0.3 25 7.521.17
= 16.6% s2 = 93.24%
s = 9.66%
Security B:
(A) (B) (A) x (B) Weighted
Probability Return Expected Return Deviation
P(ki) (ki)  (ki- )2P(ki)
0.1 5% 0.5% 2.704%
0.3 7 2.1 3.072
0.4 12 4.8 1.296
0.2 14 2.82.888
= 10.2% s2 = 9.96%
s = 3.16%
Security ASecurity B
= 16.6% = 10.2%
s = 9.66% s = 3.16%
We cannot say which investment is "better." It would depend on the investor's attitude toward the risk-return tradeoff.
6-5B.
Common Stock A:
(A) (B) (A) x (B) Weighted
Probability Return Expected Return Deviation
P(ki) (ki) (ki- )2P(ki)
0.2 10% 2.0% 2.89%
0.6 13 7.8 0.38
0.2 20 4.07.69
= 13.8% s2 = 10.96%
s = 3.31%
Common Stock B
(A) (B) (A) x (B) Weighted
Probability Return Expected Return Deviation
P(ki) (ki) (ki- )2P(ki)
0.15 6% 0.9% 5.67%
0.30 8 2.4 5.17
0.40 15 6.0 3.25
0.15 19 2.857.04
= 12.15% s2 = 21.13%
s = 4.60%
Common Stock A is better. It has a higher expected return with less risk.
6-6B.
(a) = + Beta
= 8 % + 1.5 (16% - 8%)
= 20%
(b) The 20 percent "fair rate" compensates the investor for the time value of money and for assuming risk. However, only nondiversifiable risk is being considered, which is appropriate.
6-7B. Eye balling the characteristic line for the problem, the rise relative to the run is about 1.75. That is, when the S & P 500 return is four percent Bram's expected return would be about seven percent. Thus, the beta is also approximately 1.75 (7 ÷ 4).
6-8B.
+ x Beta =
A 6.75% + (12% - 6.75%) x 1.40 = 14.10%
B 6.75% + (12% - 6.75%) x 0.75 = 10.69%
C 6.75% + (12% - 6.75%) x 0.80 = 10.95%
D 6.75% + (12% - 6.75%) x 1.20 = 13.05%
6-9B. = + (Market Return - Risk-Free Rate) X Beta
= 7.5% + (10.5% - 7.5%) x 0.85
= 10.05%
6-10B. If the expected market return is 12.8 percent and the risk premium is 4.3 percent, the riskless rate of return is 8.5 percent (12.8% - 4.3%). Therefore;
Dupree = 8.5% + (12.8% - 8.5%) x 0.82 = 12.03%
Yofota = 8.5% + (12.8% - 8.5%) x 0.57 = 10.95%
MacGrill = 8.5% + (12.8% - 8.5%) x 0.68 = 11.42%
6-11B.
O'Toole Baltimore
Time Price Return Price Return
1 $22 $45
2 24 9.09% 50 11.11%
3 20 -16.67% 48 -4.00%
4 25 25.00% 52 8.33%
A holding-period return indicates the rate of return you would earn if you bought a security at the beginning of a time period and sold it at the end of the period, such as the end of the month or year,
6-12B.
(a) Sugita Market
Month kt (kt -  )2 kt (kt - )2
1 1.80% 0.01% 1.50% 0.06%
2 -0.50 5.68 1.00 0.06
3 2.00 0.01 0.00 1.56
4 -2.00 15.08 -2.00 10.56
5 5.00 9.71 4.00 7.56
6 5.00 9.71 3.00 3.06
Sum 11.30 40.20 7.50 22.86
1.88% 1.25%
(Sum ÷ 6)
22.60% 15.00%
Variance 8.04% 4.58%
(Sum ÷ 5)
2.84% 2.14%
b.
= + (Market Return - Risk-Free Rate) X Beta
= 8% + [(15% - 8%) X 1.18] = 16.26%
c. Sugita's historical return of 22.6 percent exceeds what we would consider a fair return of 16.26 percent, given the stock's systematic risk.
6-13B
a. The portfolio expected return, p, equals a weighted average of the individual stock's expected returns.
p = (0.10)(12%) + (0.25)(11%) + (0.15)(15%) + (0.30)(9%) + (0.20)(14%)
= 11.7%
b. The portfolio beta, ßp, equals a weighted average of the individual stock betas
ßp = (0.10)(1.00) + (0.25)(0.75) + (0.15)(1.30) + (0.30)(0.60) + (0.20)(1.20)
= 0.90
c. Plot the security market line and the individual stocks

d. A "winner" may be defined as a stock that falls above the security market line, which means these stocks are expected to earn a return exceeding what should be expected given their beta or systematic risk. In the above graph, these stocks include 1, 2, 3, and 5. "Losers" would be those stocks falling below the security market line, that being stock 4.
e. Our results are less than certain because we have problems estimating the security market line with certainty. For instance, we have difficulty in specifying the market portfolio.
6-14B
a) Market Hilary’s
Month Price kt (kt- )2 Price kt (kt- )2
| Jul-02 | 1328.72 | 21.00 | ||||
| Aug-02 | 1320.41 | -0.63% | 0.0002 | 19.50 | -7.14% | 0.0211 |
| Sep-02 | 1282.71 | -2.86% | 0.0013 | 17.19 | -11.85% | 0.0369 |
| Oct-02 | 1362.93 | 6.25% | 0.0031 | 16.88 | -1.80% | 0.0084 |
| Nov-02 | 1388.91 | 1.91% | 0.0001 | 18.06 | 6.99% | 0.0000 |
| Dec-02 | 1469.25 | 5.78% | 0.0026 | 24.88 | 37.76% | 0.0924 |
| Jan-03 | 1394.46 | -5.09% | 0.0034 | 22.75 | -8.56% | 0.0254 |
| Feb-03 | 1366.42 | -2.01% | 0.0007 | 26.25 | 15.38% | 0.0064 |
| Mar-03 | 1498.58 | 9.67% | 0.0080 | 33.56 | 27.85% | 0.0419 |
| Apr-03 | 1452.43 | -3.08% | 0.0014 | 43.31 | 29.05% | 0.0470 |
| May-03 | 1420.60 | -2.19% | 0.0008 | 43.50 | 0.44% | 0.0048 |
| Jun-03 | 1454.60 | 2.39% | 0.0003 | 43.50 | 0.00% | 0.0054 |
| Jul-03 | 1430.83 | -1.63% | 0.0005 | 43.63 | 0.30% | 0.0050 |
Sum 8.52% 0.0225 88.42% 0.2948
b)  0.71% 7.37%
Standard deviation 4.52% 16.37%
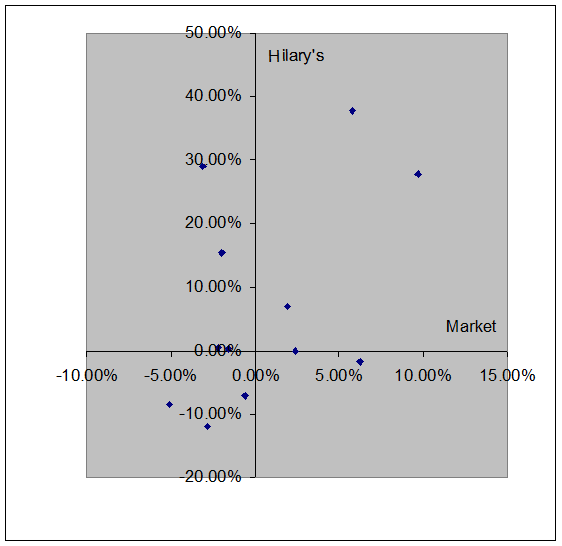 |
d. The Hilary’s returns for the last six months of 2002 and the first six months of 2003 were partially correlated, but with a lot of the variance in the stock’s returns, clearly not explained by the market—as would be expected.
6-15B
Stock A
(A) (B) (A) x (B) Weighted
Probability Return Expected Return Deviation
P(ki) (ki) (ki- )2P(ki)
0.10 -4% -0.40% 16.384%
0.30 2 0.60 13.872
0.40 13 5.20 7.056
0.20 17 3.40 13.448
= 8.80% s2 = 50.76%
s = 7.125%
Stock B
(A) (B) (A) x (B) Weighted
Probability Return Expected Return Deviation
P(ki) (ki) (ki- )2P(ki)
0.13 4% 0.52% 13.658%
0.40 10 4.00 7.225
0.27 19 5.13 6.092
0.20 23 4.60 15.31
= 14.25% s2 = 42.285%
s = 6.503%
Stock C
(A) (B) (A) x (B) Weighted
Probability Return Expected Return Deviation
P(ki) (ki) (ki- )2P(ki)
0.20 -2% -0.40% 27.145%
0.25 5 1.25 5.406
0.45 14 6.30 8.515
0.10 25 2.50 23.562
= 9.65% s2 = 64.628%
s = 8.039%
Stock B has a higher expected rate of return with less risk than Stocks A and C.
6-16B
+ x Beta =
K 5.5% + (11% - 5.5%) x 1.12 = 11.66%
G 5.5% + (11% - 5.5%) x 1.30 = 12.65%
B 5.5% + (11% - 5.5%) x 0.75 = 9.63%
U 5.5% + (11% - 5.5%) x 1.02 = 11.11%
6-17B
Watkins Fisher
Time Price Return Price Return
1 $40 $27
2 45 12.50% 31 14.81%
3 43 -4.44 35 12.90
4 49 13.95 36 2.86
6-18B
(a) = + Beta
= 4% + 0.95 (7% - 4%)
= 6.85%
(b) = + Beta
= 4 % + 1.25 (7% - 4%)
= 7.75%
(c) If beta is 0.95:
Required rate = 4 % + 0.95 (10% - 4%)
of return
= 9.7%
If beta is 1.25:
Required rate = 4 % + 1.25 (10% - 4%)
of return
= 11.5%
Дата добавления: 2015-10-30; просмотров: 122 | Нарушение авторских прав
| <== предыдущая страница | | | следующая страница ==> |
| END-OF-CHAPTER PROBLEMS | | | CHAPTER OUTLINE |