|
Читайте также: |
(for example, the typical areas of south-western Siberia)
Chupina D.A.
V.S. Sobolev Institute of Geology and Mineralogy SB RAS, Novosibirsk, Russia
dasha.chupina@gmail.com
The science of the Earth has received a new source of information and powerful tools for their research with the advent of geographic information systems (GIS) and digital elevation models (DEM). GIS technology is actively used in the geomorphology for zoning of the territory, mapping forms and types of terrain. The practical aspect of GIS introduce in geomorphological mapping is to develop the standard procedures that would enable to replicate it for the solution of industrial problems, particularly for geological and landscape mapping.
GIS technology has decided to the technical difficulties of morphometric studies. So it has given the impetus to the development of modern explanatory morphometry of the relief, which is focused on a disclosure of quantitative characteristics of the relief and its origin. It seems timely, development of techniques that would allow recognize the genetic types of the terrain with morphometric indices. The methodology promising in this aspect are implemented in the digital image processing systems. It repeatedly tested for the mapping and the monitoring of landscapes, natural-territorial complexes, geological objects and other. The author offers the technology of mapping morfocomplexes on a basis of using the supervised classifications for the key morphometric characteristics (for example, the terrain of Chuy valley).
The different sources can be used as a basis for the construction of DEM. However, the using of the sharing DEM are significantly reduced the difficulty of research. In our case, the digital elevation model SRTM was taken on with the resolution of 90x60 meters, and reduced to the size of pixels 90x90 m. Some of shapes of the Earth's surface can totally get into the pixel of this size, and some of them only partially. Morphometric parameters are calculated with the method of the sliding window. The size of the sliding window is chosen so that it got the basic forms of the earth's surface. So it is possible to obtain a grid-mean morphometric parameters that reflect the most common types of the relief. The window's size was chosen from the series of experiments and amounted to 1260 m (the diameter of the window is 14 pixels).
The modern morphological structure in the mountains were formed not only as a result of a variety of exogenous processes. The latest movements of tectonic blocks have had a great influence too. It is necessary to consider the mapping the genetic types of relief. This has reflected in the values of absolute morphometric parameters - heights, aspects and slopes. If the relief was formed under the influence of neotectonic movements, at the beginning it is necessary to zone it. Further studies are mainly based on relative morphometric parameters. It is representing the difference of maximum and minimum values of variable (range), calculated within a sliding window. In our case, the 8 most common indicators are used to highlight the morfocomplexes. These are the mean values of slope, the mean values of heights, the mean values of submeridian aspects, the mean values of sublatitudinal aspect, range of slope, range of heights (vertical dissection), range of values sublongitudinal aspects, range of values sublatitudinal aspect. It has directly calculated from DEM with the ArcMap software package.
The analysis of each morphometric parameters has found out similar for some of these genetic types of a relief to each other and join together in groups. Also analysis have detected the parameters which help to separate the genetic types of a relief with greater or lesser degree of reliability. The branching scheme of dichotomous splitting of a relief to separate types and their groups is thus built. The most efficient morphometric parameters, or combinations thereof are selected for each point of the branching. The morphometric parameters selected are normalized to maximum and converted into the TIF format. The images are then loaded in the form of channels in ENVI software package for further classification with the training on the reference sites. According to the dichotomous scheme the general classification of all morfocomplexes is not used at once, it is used branched series of classifications.
The recognition of terrain types is carried out for each neotectonic segment. At first, the segment is divided to the dissected and flat areas. Further, the masks are constructed on base of allocated sites. It's the area where classification will be applied. It is improve the accuracy of classifications. Space of recognition and amount allocated classes of relief are reduced at each step.
The proposed approach has some limitations. On the one hand, not all the genetic types of relief detected in the field conditions can be recognized on only the morphometric features. On the other hand, some morfocomplexes can be statistically stay apart by the morphometric parameters, if they were not considered significant for some reason in another feature space. The possibility of the separation and detection morfocomplexes largely controlled by the spatial resolution of DEM. It not always is possible to identify the genetic type of the relief, consisting of the small forms or having a limited areal distribution.
The proposed method is automatically enabled the mapping of morfocomplexes of Chu steppes, which isn't inconsistent with the geomorphological precursors studies [3]. The summary diagram of morphological complexes as a result of consecutive series of classifications are shown in the picture.

Fig. Symbols: 1 — glacial trough-ridge, 2 — talus-proluvial, 3- erosion gully-ravine, 4 — limnetic at the aleurite -sand base, 5 — limnetic with a bars, 6 — limnetic at the moraine base, 7 — alluvial of the Chu river valley, 8 — thermokarst, 9 — alluvial of incised valleys, 10 — alluvial of tributaries.
This studies has shown advisability of aggregation methods of processing raster images (ENVI) and grids modeling (ArcGis) to mapping morfokomplexes. The using of relative morphometric parameters allowed to move out from the mapping of landforms and their elements to the mapping of types of relief, which are the natural combination of typical geomorphological sites. And finally, the using of supervised classifications does propose the technology easily accessible and replicated. The proven technology is promising for the medium-scale geomorphological map construction at the landscape and geological mapping
References:
1. Simonov JG. Explanatory morphometry of relief. - Moscow: GEOS, 1999. - 263 p.
2. Zolnikov ID, Lyamina VA, Glushkov, NV.The basics of using GIS and RS technology for solving typical problems of Geology and Geoecology: Textbooks / Novsib. State. University v.2. Novosibirsk, 2011, 94 p.
3. Zolnikov ID, EV Deev, VA Lyamina. New data on Quaternary morpholithogenesis in the Chuya basin (Gorny Altai)// Geology and Geophysics, 2010, V.51, № 4. P. 437-449.
Creation and information of a GIS “Ground Movements” atlas in the Lot-and-Garonne region (France)
Desport R.1, Flouest N.2
1University of Bordeaux 3 EGID Institute, Pessac, France; 2 LRPC, Bordeaux, France
romain.desport@hotmail.fr
This six months internship had for main goal to list, locate and characterize the major ground movements that occurred in the region of Lot-and-Garonne and then to integrate the data into an inventory using MapInfo software.
Indeed, this region is really affected by varied and complex ground movements. The LRPC (Bridges-and-Causeways Regional Laboratory) of Bordeaux has realized these last 40 years numerous studies or interventions on the subject.
A bibliographical study of the LRPC archives in Bordeaux allowed to define a movements typology in the order to offer a synthesis of geotechnical characteristics at the scale of this region.
The ground movements concerned by this regional inventory are the phenomena of landslides (superficial and deep slides, bank erosion), falls (stones, blocks and heap of rocks) and collapses (soil compaction, sinkhole, subsidence).
The creation of this Lot-and-Garonne “ground movements” atlas, the information of data in the BRGM (Mining and Geological Research office) Ground Movements Database about the Dordogne region as well as all others missions realized during this internship were done in the aim to improve the consideration of " natural hazards " within the framework of the sustainable territory development.
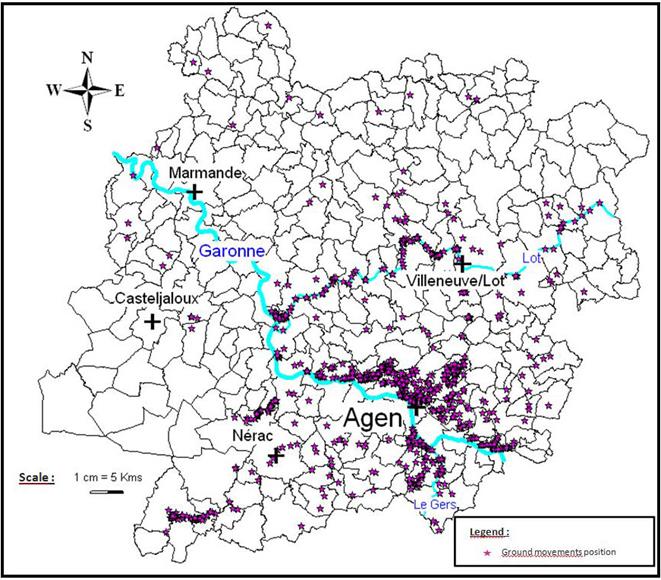
Fig. Map of the Lot-and-Garonne «Ground movements» localization
References:
1. LRPC archives for the Lot-and-Garonne atlas information.
2. Ministry of Ecology and Sustainable Development, Major natural hazards information file abstract of «The ground movements», September 2004.
3. General guide of the Environment and Territory Planning Ministry and the Equipment, Transport and Housing Ministry «Prevention Plans about predictable Natural Hazards (PPNH)», the French Documentation.
4. Methodological guide of the Ecology and Sustainable Development Ministry, «Schematic of risks itinerary», Research Operation 11M052: rock risks,.
5. BRGM, «Establishing Prevention Plan for Natural Hazards of differential soil movement risk due to shrinkage and swelling of clays» RP-51995-FR (Lot-and-Garonne), February 2003.
6. Pomerol, C. Lagabrielle, Y. and Renard, M., «Geology Elements», Dunod, 13° edition.
7. Foucault, A. and Raoult, J-F., «Geology Dictionnary», Dunod, 6° edition.
8. XXVIe International Geological Congress, Geological risks «Ground movements», LRPC Newsletter, Environnement and Living Area Ministry, Transports Ministry, January 1981
9. Costet, J. and Sanglerat, G., «Practical courses on Soil Mechanics», Dunod.
10. Publication of all major natural and technological hazards maps by the Ministry of Ecology, Energy, Sustainable Development and Spatial Planning
http://cartorisque.prim.net/index.html
11. BRGM database:
http://www.bdmvt.net/
12. Purchasers and tenants risks information in Lot-and-Garonne:
http://www.lot-et-garonne.pref.gouv.fr/1-8931-Information-des-acquereurs-et-des-locataires-sur-les-risques.php
13. Natural hazards glossary:
http://www.vol.be.ch/site/fr/naturgefahren/naturgefahren-a-z.htm
14. Major hazards prevention portal:
http://www.prim.net/cgi_bin/citoyen/macommune/bddrm_detail_commune.php?insee=47157
15. National Assembly Report about landslides and rockfalls:
http://www.assemblee-nationale.fr/rap-oecst/risque95/titre2.asp
GIS-analysis of Novosibirsk's Academytown forests antropogenic transformation
(on the base of geological and geobotanical investigations)
Glushkova N.V.
V.S. Sobolev Institute of Geology and Mineralogy SB RAS, Novosibirsk, Russia
hope@igm.nsc.ru
A characteristic feature of the Novosibirsk Academyctown is a diffuse development, "the basis of which is the interpenetration of living and working quarters, and large amounts of untapped natural trees" [1], which allows you to call him Ecopolis in its modern sense [2]. Thus, the city-forest or Ecopolis for V.V. Vladimirov [2] is a heterogeneous natural and man-made system for which characterized the spatial mosaic distribution of a different types of terrain. Therefore, to study ecosystems of Academyctown using complex technology of GIS modeling of complex natural and human systems, which developed on the basis of the technology of heterogeneous environmental systems (HES) [3]. This allows not only the map, but also to assess the contribution of different types of natural and man-made objects (depending on their percentage) in the HES.
For mapping forest cover of Academyctown (the territory of the Pirogov forests and the Central Siberian Botanical Garden, CSBG SB RAS), we used the analysis and comparison of two high-resolution satellite imagery QuickBird: late autumn and summer [4]. Autumn image used for the selection of conifers, as species of deciduous trees have dropped their leaves, and pine still remained green. Technology of automatic classification of high-resolution image was developed to estimate the density of the forest and the ratio coniferous and deciduous trees. The technology consist of in conducting the classification of satellite images, convert classification results into a vector format, and the subsequent construction of density grids. In carrying out the maximum likelihood supervised classification in the autumn image were allocated area of coniferous forests. The resulting class is converted into a vector layer showing the distribution and the closeness of coniferous trees in the studied forests. In the summer image deciduous and coniferous tree species are close in the space of spectral features and difficult to recognize by the methods of automatic classification. However, this picture represents true picture of distribution and canopy of deciduous trees in the forests of Academyctown, while the characteristics of their closeness obtained at the late autumn images greatly underestimated. Vector obtained by classifying the summer image by maximum likelihood method, is presented as a canopy of deciduous and coniferous trees. In order to highlight the crowns from the vector of all deciduous and coniferous forest trees was carried out overlay operation. For this purpose the vector layer of coniferous trees, derived from the autumnal image overlay on the vector layer of all the forest derived from summer image The result was obtained by three types of objects: the crown of coniferous trees, the crowns of deciduous trees and open spaces. In order to divide the vector projections on the crowns of the forest deciduous and coniferous trees was carried out overlay operation. For this the vector projection of crowns of coniferous trees, derived from the autumn image imposed on the vector of all the forest and get the location of pine trees. Then a series of density schemes (with a cell size grid of 2,5 m and 50 m radius of the window) were constructed, reflecting the projection of summer crowns forests, forests by the ratio of pine and deciduous woods.
Then the study area of Academyctown was divided into areas of geological and geomorphological grounds. The three terraces, the watershed, and the transition zone between them were allocated. The boundaries were based on analysis of satellite image and digital elevation model (DEM). Then overlay operations were carried out with the geological and geomorphological scheme and the scheme of vegetation, built by satellite images. Finally we got the dependence of vegetation on the geological-geomorphological structure of the territory. Analysis of the patterns showed that on the terraces is dominated by coniferous and deciduous-coniferous forests, and deciduous and coniferous-deciduous in the sum does not exceed 7%. On watersheds, by contrast, deciduous and pine-deciduous forests is dominated (in the amount of about 97%). In the intermediate zone between the terraces and the watershed mixed forests is dominated - pine-deciduous and deciduous-pine, and clearly visible to the correlation of density - the denser it is, the greater is the area, and deciduous and coniferous forests of different density occupy less than 12%.
The comparative analysis of the natural-spatial structure of the two major forest areas using GIS technology and remote sensing data showed highly informative method, the ability to identify relationships between geomorphological features of the territory, the composition of surface deposits and the structure stands. The method makes it possible to assess whether the present structure and the closeness of the stand reflect the range of natural causes, and how preceded human activities effect on these parameters. Using high resolution satellite images and modern GIS technology allows for the operational monitoring of forest conditions and a rapid assessment of the degree of anthropogenic transformation.
References:
1. Nature of Academyctown: 50 years later / executive Editor I.F. Zhimulev. Novosibirsk: Publishing House of SB RAS, 2007. 250 p.
2. Vladimirov V.V. Urboecology Lectures. - M: MNEPU, 1999. 204 p.
4. Zolnikov I.D., Lyamina V.A., Korolyuk A.Y. Complex technology of mapping and monitoring heterogeneous landscapes // Geography and Natural Resources. 2010. № 2. P. 126-131.
5. Glushkova N.V., Zolnikov I.D., Lyamina V.A., Makunina N.I., Mal'tseva T.V. Mapping of the forests of Central Siberian Botanical Garden // Bulletin of the NSU. - 2010. - Volume 8, № 3. P. 83-91
Дата добавления: 2015-10-29; просмотров: 123 | Нарушение авторских прав
| <== предыдущая страница | | | следующая страница ==> |
| Seismic hazard analysis by using a non-poissonian probabilistic approach | | | Proper Kv/Kh for reservoir simulation: use of core images |