|
Читайте также: |
1. For construction of plots use functions of Scilab - plot() and fplot().
2. Create plots of the functions y(x) and g(x):
· in the same graphic window;
· in different graphic windows;
· in two different subregions of the figure window.
3. In second column of the table 5.2 it are given two parameter functions f(t) and z(t). Create plot related z of f.
4. Create 3D plot for function of two arguments in second column.
5. Use two ways to edit the graphs you create: 1) Interactive Plot Editing, 2) SCILAB commands.
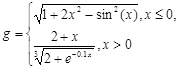
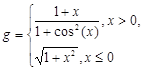
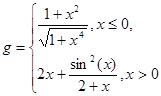
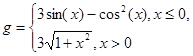
Table 5.2 – Individual tasks
| № | for x € [-2,2] | for t € [0,2π] |
 , ,

| f=2sin(t) cos(t),
z=3cos2(2t) sin(t)

| |


| f=2sin(pt)-3cos(pt),
z=cos2(2pt) sin(pt)

| |


| f=5sin(pt)-cos(3pt),
z=cos(2pt)-2sin3(pt)

| |


| f=3sin(2px)cos(pt)- cos2(3pt),
z=2cos2(2pt)-3sin(3pt)

| |


| f=2sin(pt)cos(pt),
z=cos2(pt)sin(3pt)

| |

| f=3sin(3pt)cos(2pt),
z=cos3(4pt)sin(pt)

| |

| f=2sin(2pt)cos(4pt),
z=cos2(3pt)-cos(px)sin(pt)
| |


| f=sin(3pt)+2sin(2pt)cos(3pt),
z=cos(pt)cos(3pt)sin2(pt)

| |
|
| f=2sin(2pt)cos(4pt),
z=cos2(3pt)-cos(pt)sin(pt)

| |


| f=sin(pt)cos(3pt)+ +2sin(3pt)cos(2pt),
z=cos2(pt)-cos(3pt)

| |


| f=2sin(pt)cos(pt),
z=cos2(pt)sin(3pt)

| |

| f=3sin(3pt)cos(2pt),
z=cos3(4pt)sin(pt)

| |
| ,
| f=2sin(t) cos(t),
z=3cos2(2t) sin(t)
| |

| f=2sin(pt)-3cos(pt),
z=cos2(2pt) sin(pt)

| |

| f=5sin(pt)-cos(3pt),
z=cos(2pt)-2sin3(pt)

| |


| f=3sin(2pt)cos(pt)- cos2(3pt),
z=2cos2(2px)-3sin(3px)
| |
|
| f=2sin(px)cos(pt),
z=cos2(px)sin(3p)
| |

| f=3sin(3pt)cos(2pt),
z=cos3(4px)sin(pt)
| |

| f=2sin(2pt)cos(4pt),
z=cos2(3pt)-cos(pt)sin(pt)

| |


| f=sin(3pt)+2sin(2pt)cos(3pt),
z=cos(pt)-cos(3pt)sin2(pt)

| |


| f=2sin(2pt)cos(4pt),
z=cos2(3px)-cos(px)sin(px)

| |


| f=sin(pt)cos(3pt)+ +2sin(3pt)cos(2pt),
z=cos2(pt)-cos(3pt)

| |


| f=2sin(pt)cos(pt),
z=cos2(pt)sin(3pt)

| |


| f=3sin(3pt)cos(2pt),
z=cos3(4pt)sin(pt)
| |
 , ,
| f=2sin(t) cos(t),
z=3cos2(t) sin(t)
| |

| f=2sin(pt)-3cos(pt),
z=cos2(2pt) sin(pt)

|
Test Questions
1. Describe basic plotting commands.
2. How to set the line styles, colors, and markers of the graph?
3. How to create line plots that have left and right y-axes?
4. Adding annotations, axis labels, titles, and legends to graphs.
5. How to edit plot in Scilab?
6. What functions do you use for the visualization of 3D data?
Laboratory work № 6
programming in Scilab
Дата добавления: 2015-10-29; просмотров: 205 | Нарушение авторских прав
| <== предыдущая страница | | | следующая страница ==> |
| Printing from the Menu | | | Порядок виконання |