|
Читайте также: |
Our 3rd case study’s business problem included the continuation of the case study II. This time we had chosen 45 random companies out of 50 that we have already had. We studied their current and previous revenues and profits and made conclusions. In this case study you may see how we have analyzed the companies’ revenue which has included such aspects as: paired hypothesis testing, scatter plot of the two variables, the correlation coefficient, the coefficient of determination, the regression equation, residual etc. Due to the list above we have made specific conclusions, and could imagine the picture overall. Our goal was to assess our ability by locating data, performing appropriate test, analyzing results and creating both a written and presentational business report on our findings. Also to apply our ability by presenting statistical information in our business application. We used Excel to randomly select 45 companies out of 50 that were provided by the 2nd case study. We assigned a random number from 0 to 1 to each company using (=RAND) formula. We identified revenues for the previous year as “x” and revenues of the current year as “y”.
Firstly, we will use a paired hypothesis test to determine if there is a difference of zero between the current revenue and the previous revenue.
1) Claim: There is a difference of zero between the two data sets.
H0: µ1 = µ 2 (claim)
Ha: µ 1 ≠ µ 2
2) Level of significance: Concerning that the level of significance is not given to us, we will use α as 0.05 which is a standard one.
3) Defining the distribution: Since our sample size n (45) > 30, so we can conclude that this is a normal distribution with large sample and independent variables. Thus, we will use a z-test.
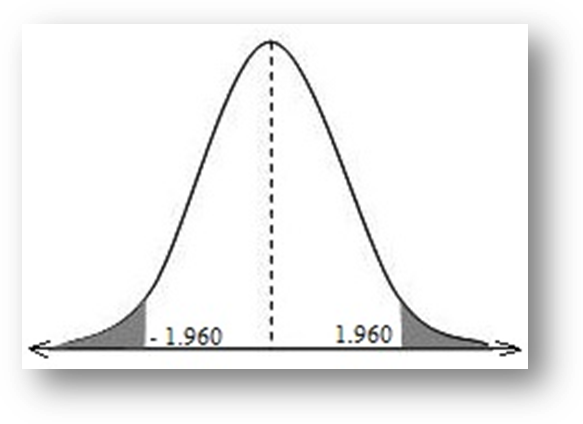
4) Finding the critical value: We can conclude that our example is a two-tailed test, because of the sign of Ha “≠”, which means that the areas in the rejection regions are equal. With the help of the t-distribution table, the area that corresponds to α=0.05 and two-tail, is 1.960. Since it is two-tailed test both negative (z0= - 1.960) and the positive values (z0= 1.960) are the critical values.
5) Sketching the graph:
6) The test statistic: Because the variances are not equal, we used the following formulas:and 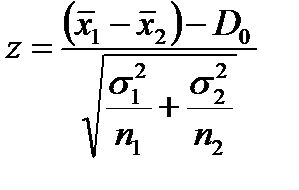 and
and 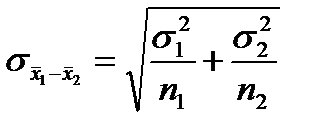
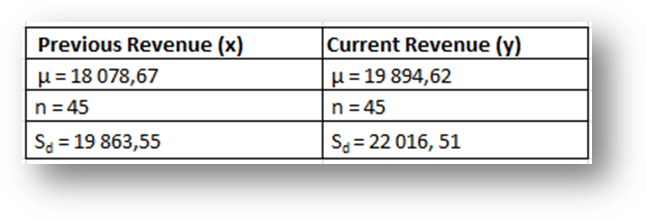 Table 1
According to our table 1 we count the formula.
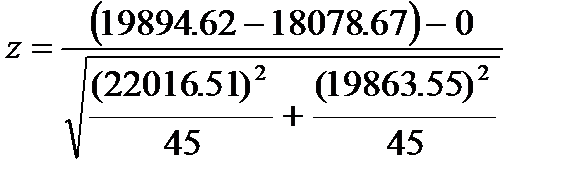 = 0,2909
7) Make a decision:
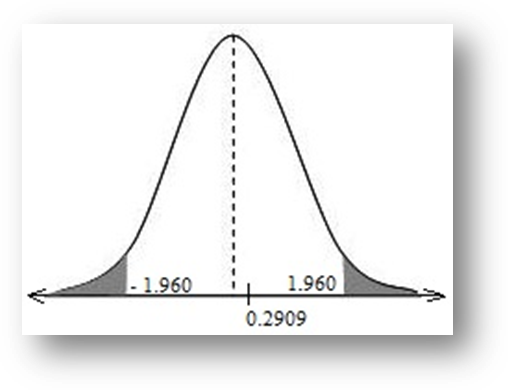
z = 0,2909 meaning that it does not fall into our rejection regions. Therefore, we fail to reject the null hypothesis.
8) Interpreting the result: There is not enough evidence to reject our claim. We may conclude that there is not enough evidence to state that the difference between means of two data sets is equal to zero.
Дата добавления: 2015-10-24; просмотров: 140 | Нарушение авторских прав
| <== предыдущая страница | | | следующая страница ==> |
| Письмо из Бразилии». | | | Alcohol is the most common cause of fatty change and cirrhosis of the liver |