|
Читайте также: |
Main criteria for normal operation of shafts are their rigidity and robustness. During operation shafts are subjected to cyclic varying loads leading to fatigue related rapture.
Major calculated loads are torque and bending moment.
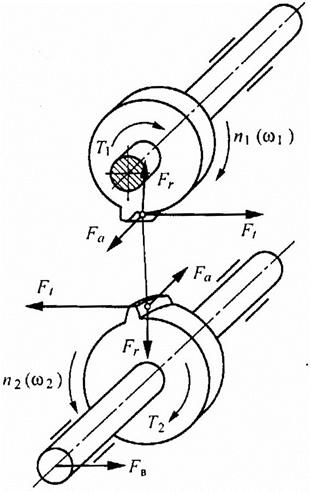 Figure 11 b
|  Figure 11 b
|
| Torque acting at calculated cross section of shaft numerically equals to torque transmitted. Test calculation of fatigue strength shall be conducted upon definition of final shaft design and dimensions resulted upon drawing the sketch schematics (Figure 11). |
Upon making calculated schematics (Figure 11 a) the shafts are considered as straight bars laying on rocker bearings (Figure 11 b).
All outside forces loading the shaft are lined up in calculation schematics. The forces shall be placed in corresponding orthogonal surfaces:  horizontal and
  vertical.
Then, after assessing rocker bearings reactions, bending moment curves  ,
,  and torque curve
  are lined up.
In the coursework it’s recommended to take cross-section line weakened by tab groove as a risky one.
Mechanical characteristics of steels are outlined in Table 9.
Table 9.
Mechanical characteristics of steels
| Steel grade | Blank diameter, mm, not less than | Hardness NV, not less than | Mechanical characteristics, MPa | ||||

| 
| 
| 
| 
| |||
| 40Х | Any | ||||||
| £200 | |||||||
| £120 | |||||||
| 40ХН | Any | ||||||
| £200 |
The test calculation of fatigue value is aimed at defining actual safety margin ratio at risky cross-section.
Safety margin fatigue strength ratio to be calculated as per the following formula:
 ,
,
where,  – safety margin ratio of bending stress,
 – safety margin ratio of spinning stress,
 – permissible safety margin ratio
 .
.
Safety margin ratio to be calculated as per the following formulas:
 ;
;  ,
,
where , – strength margins of shaft materials during symmetric cycle of bending and spinning;
 ,
,  – stress concentration ratios, taking into account the impact of all factors on fatigue strength;
 ,
,  – amplitudes of cycles of simple and tangential stress variation;
 ,
,  – ratios of material sensitivity to asymmetry of stress cycle to be taken as recommended as:
 ;
;  ;
;
 ,
,  – average stresses of cycles of simple and tangential stress variation;
During calculation it’s assumed that simple stresses vary vs. symmetric cycle, i.e.
 ,
,  ,
,
and tangential ones vs. zero-to-stress cycle
 .
.
Here  и
и  – maximum simple and tangential stresses values at risky cross-section.
Maximum simple and tangential stresses values at risky cross-section are to be calculated as per the following formulas:
 ,
,  ,
,
where где  , – summed bending moment and torque value at risky cross-section;
 – axial and polar moments of shaft risky cross-section strength.
Moments of shaft cross-sections with tab groove width of b and depth  to be calculated per equations
 ,
,  .
.
To calculate summed bending moment and torque values at risky cross-section it’s required to line up calculated shaft scheme, calculate reactions of rocker bearings, line up curves of bending moments in horizontal and vertical surfaces and torque curve as well.
Summed bending moment at cross-section to be calculated per equation
 ,
,
where где  , – bending moment at reviewed cross-section in horizontal and vertical surfaces.
Stress concentration ratios at risky cross-section to be calculated per equations
 ;
;  ,
,
where где  ,
,  – effective stress concentration ratios of simple and tangential stresses values for concentrator or tab groove (Table 10);
 – ratio, taking into account shaft surface roughness at reviewed cross-section. When alloy steels are used for shaft production it’s required to fine grind surfaces adjacent to stress concentration areas,
  ;
;
 – ratio taking into account scale factor (Table 11);
 – ratio taking into account impact of surface compaction. If not available, then
  .
.
Table 10.
Values и for the shafts with tab groove, made by end milling cutter
 , MPa , MPa
| ||||||

| 1,8 | 1,9 | 2,0 | 2,15 | 2,25 | 2,4 |

| 1,4 | 1,6 | 1,75 | 1,9 | 2,0 | 2,2 |
Table 11.
Scale factor
 , mm , mm
| ||||||

| 0,88 | 0,82 | 0,79 | 0,76 | 0,70 | 0,65 |
If  , shaft strength has to be increased
Дата добавления: 2015-10-31; просмотров: 101 | Нарушение авторских прав
| <== предыдущая страница | | | следующая страница ==> |
| Selection of rolling bearings | | | GUIDELINES TO EXECUTION OF GRAPHIC PORTION OF THE COURSE WORK |