Читайте также:
|
Major Players and Trading Partners
Ukrainian grain market aimed at exports. In 2011/2012 MYthe total grain supply of Ukraine was equal to 62.6 MMT and consisted of produced grain (86.4%), initial stocks (13.3%) and import (0.3%). Grain consumption in Ukraine averaged 54.3% of domestic output. Exports could amount to potential 45.7% (24.7 MMT) of grain output against actual 39.7% (21.5 MMT).
Agriholdings are powerful grain manufacturers. Vertically integrated companies hold one fifth of the nonconcentrated market of grain production. Such companies as Nibulon and Kernel obtained international syndicated loans to expand chains of grain elevators or to carry out energy saving projects (MHP, Astarta) and simultaneously strengthened their market positions. Agriholdings generate a ROE of 21.8% as a result of diversification. Thus, manufactured grain is mostly used for further production needs (30% – feed, 5% – seeds), food consumption (11%), exports performed by grain traders that are not always a part of an agriholding (32%) in 2011/2012 MY.
Table 1: Performance of Ukrainian Listed Companies in 2011
Financial indicators of Ukrainian Agriholdings which have Large Landbanks [D2]
| Company | Landbank, ths ha | under grain | EBITDA/ ha, USD | Gross margin | EBITDA margin | % of Grain in Revenue | |
| MHP S.A. | 78% | 1432,1 | 29% | 33% | 9% | ||
| Astarta Holding NV | 43% | 617,4 | 40% | 37% | 26% | ||
| Kernel Holding SA | 44% | 1474,8 | 24% | 16% | 36% | ||
| Agroton Public Ltd | 52% | 143,8 | 47% | 25% | 32% | ||
| Sintal Agriculture PLC | 61% | 67,6 | 35% | 21% | n/a | ||
Source: Open data provided by the companies, Bloomberg, KNU estimates
High concentration of grain export market. The Top 5 traders provide 45% of grain exports (Top 10 traders supply 59%). Traders sell grain acquired from agriholdings to which they belong or from other companies. The traders demonstrate high profitability (44% ROE) due to a small part of equity capital (D/E ratio is 11.2%) and a high level of liquidity (current ratio – 2.1). In addition, own storage facilities strengthen trader’s positions. Yet it is significantly dependent upon transport outsourcing and state regulation. Thus, close ties with the government and export quotas provided leadership to Khlib Investbud in 2011.
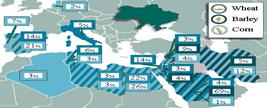
Table 2: Top 5 Grain Exporters, 2011/12 MY Figure 1: Biggest Importers of Ukrainian Grain
Shares of Companies in Grain Export of Ukraine Structure of Ukrainian Grain Import by Countries, 2011
| Company | Wheat | Barley | Corn | ||
| Khlib Investbud | 29% | 24% | 6% | ||
| Nibulon | 9% | 5% | 11% | ||
| Kernel-Trade | 8% | 10% | 8% | ||
| Louis Dreyfus C. Ukraine | 5% | 11% | 7% | ||
| Serna | 3% | 3% | 5% | ||
| Total export, mln tonnes | 5,3 | 2,5 | 13,6 | ||
Source: ISI Emerging Markets, APK Inform, KNU estimates Source: Ministry o f Agricultural Policy of Ukraine, KNU estimates
Major partners are to deepen cooperation. Ukraine is one of the leading grain exporters in the world. Thus, in 2012/2013 MY Ukraine is expected to supply 14.6% of barley, 13.8% of corn and 2.9% of wheat making it the 3rd, 4th and 8th largest exporter in the world correspondingly. Presence of seaports provides low transport costs and promotes further growth of sales in the Middle Eastern and Japanese markets. Furthermore, there has been noticed a trend toward increase of more expensive corn in the commodity structure from 18% in 2008/2009 MY to expected 66% in 2012/2013MY which confirms improvement of effectiveness of domestic exports.
Дата добавления: 2015-09-06; просмотров: 146 | Нарушение авторских прав
| <== предыдущая страница | | | следующая страница ==> |
| Длинная гонка. | | | Dynamics and Forecast of World and Ukrainian Grain Consumption, 2003/2004-2015-2016Е |