Читайте также:
|
Name: Temirlan Alimzhanov
ID: 20123078
Group: 20
Date: 30.10.2013
Graphs and Charts based on collected data
Title: Your attitude towards alcohol
These graphs and charts were built up in order to show and identify people’s attitude towards alcoholic beverages. In order to collect information there were ten participants, namely five males (50%) and five females (50%) from different age groups (18 up to 55 years old) (figure1). Majority of the participants are students from different universities; however, there are some people who already graduated and work in different spheres (figure 2).
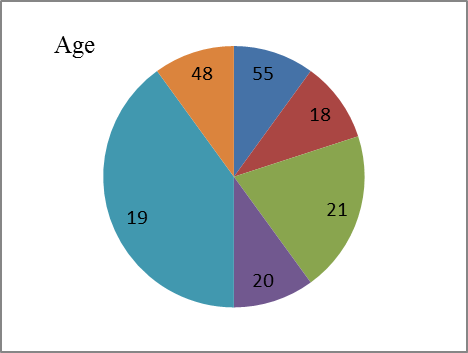
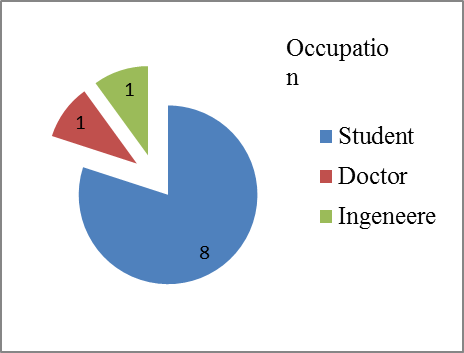
Figure 1 Figure 2
The figure three shows people’s attitude toward alcohol and according to statistics, most of the people, namely five persons (50%) answered that their attitude is Neutral which means that majority of the participants are loyal towards alcoholic beverages and probably this group of the people are at the low risk in terms of alcoholic dependents. The next majority of answers, namely three participants (30%) are in the “Positive” portion of the graph, and possibly this it shows that this group are at risk of alcohol addiction and there life are strongly connected with consuming alcohol. Other two participants answered that their attitude to alcohol is Negative, which means that the problems related to alcohol possibly the smallest in contrast with previous two groups.
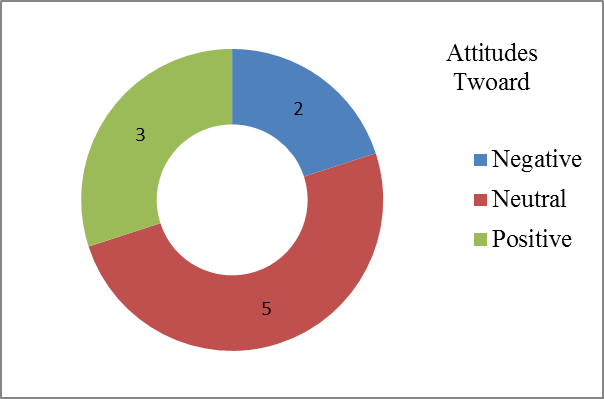 Figure 3
The figure four shows what kinds of alcoholic beverages participants are prefer more. The survey provides three categories which are: Soft (beer, wine, etc), Strong (whisky, vodka, cognac, etc) and alcoholic cocktails. According to numbers, there are two major categories of preference of the participants, namely Soft and Strong alcoholic beverages and both consist of four answers which is 40% each. Only two (20%) people answered Alcoholic cocktails. The figure four provides really important information, because it shows how fast people could use to alcohol and gain alcohol addiction. However, addiction strongly depends on measures and next figure will show how seriously people are likely to addict to alcoholic beverages.
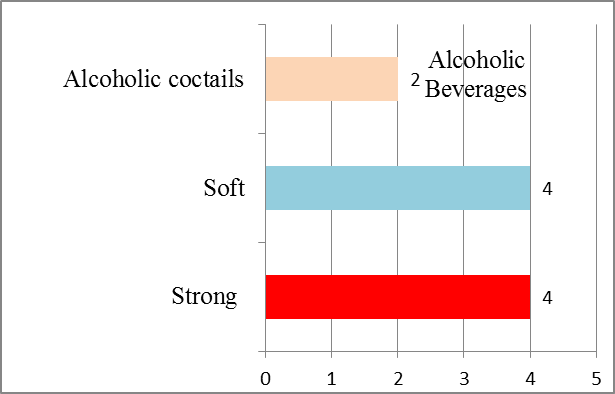 Figure 4
The figure five shows how much alcohol people are usually drinks, other words in which quantity. According to statistics, there two columns with the same numbers of answers, namely four in part “1-3 glasses” and four in “more than 1-3 glasses”(40% each). However, the meanings of the answers are completely different in compare with each other. For example, blue column shows normal or average safe amounts of alcoholic beverages which are beneficial to heals, when at the same time green column shows dangerous quantity of alcoholic beverage which is possible could lead to alcohol intoxication and eventually to alcohol addiction. The smallest ratio is in the red column “less than 1-3 glasses” and two persons (20%) are at the smallest risk of been intoxicated, nevertheless at the same time probably the quantity of alcohol is not enough to gain healing benefits.
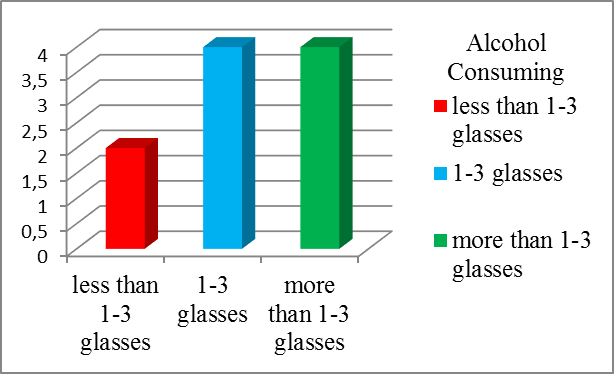 Figure 5
According to the figure six which is deals with information when people are usually drink alcoholic beverages, most of participants, namely six out of ten answered on important days such as: wedding, one’s birth day or parties. Possibly, people who had chosen this category are tend to drink more than average because of feelings of euphoria which maybe leads to different sorts of bad consequences. Another major group of four people answered that they prefer to drink alcohol during the weekend. Probably, people in this category as previous group are likely to drink more than average. The statistics showed that no one among participants do not drink any alcoholic beverages during the week which is possibly related to moral. In order to clarify statement on the last group, we could say that most of the Kazakhstani citizens would accept drinking alcohol during the week as alcoholism and it would be amoral. Probably, peoples statement based on stereotypes.
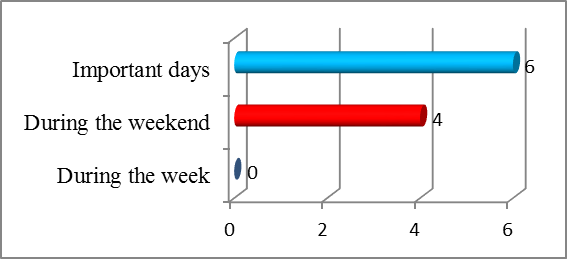 Figure 6
According to the figure seven which deals with information with whom participants are usually drink alcoholic beverages, most of the participants, namely seven persons or 70% are prefer to drink alcohol with their friend. Basically, it means that these groups of people are not under one’s control and person could drink more than normal. Eventually, it could lead to alcoholic intoxication and further problems. There are two people whom answered that they usually drink alcohol with family. This group at the lowest risk of had been over drink, because of one’s control of the measures. The smallest category is colleagues. Only one participant marked this part. Nevertheless, this group, especially in Kazakhstan, are at the highest risk of been intoxicated because usually work contains lots of stress situations and people tries to get rid of stress through high amounts of alcohol.
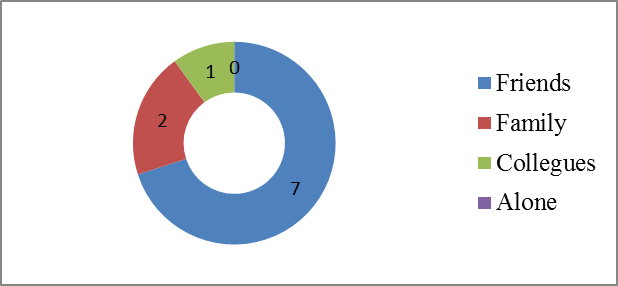 Figure 7
The figure eight shows how many people aware about healing benefits after moderate drinking alcohol. According to statistics, most of the participants, namely nine out of ten know that alcohol could be useful to one’s heals. The only one person doesn’t know about healing benefits after measured drinking alcohol. This figure is important because if people already know that alcohol can be beneficial to one’s health probably it is possible to change people’s attitude towards alcohol and build up cultural attitude to alcoholic beverages.
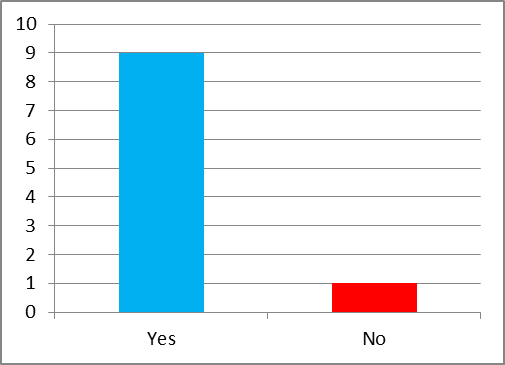 Figure 8
The statistics on figure nine provides information about people’s thoughts on future of Kazakhstani attitude towards alcohol, namely whether is it possible or not to change attitude of the citizens of the country and accept European culture of drinking. As the statistics suggests, most of participants (80%) answered that it is possible, when other 20% marked that it is impossible to accept European attitude at list in the close future. If most of the citizens of the Kazakhstan would believe that situation can be changed it means that in the future people will think differently and perhaps will foster a culture of alcohol consumption.
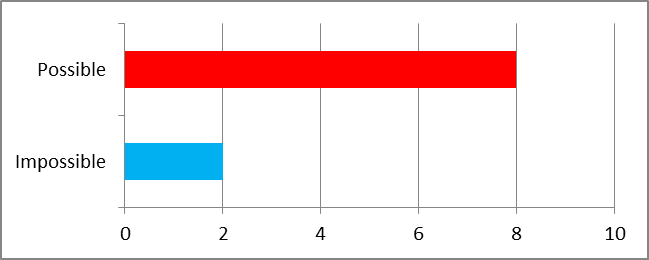 Figure 9
Дата добавления: 2015-10-30; просмотров: 80 | Нарушение авторских прав
| <== предыдущая страница | | | следующая страница ==> |
| Sentence Fragments | | | ADVERTISING. FIRST HINTS |