Читайте также:
|
 (a) Consider the dislocations randomly oriented with an average separation of 2Z. If \/:;lit > 6Z then a diffusing atom encounters several dislocations over the time t, and the effect of the dislocations is to increase the average jump frequency of the atoms in an isotropic manner, thus Deff/Di > 1. If the heat flow analogy of the grain boundary diffusion problem was a system consisting of a sheet of aluminum foil between two sheets of plastic, then the heat flow analogy here would be a system consisting of fine aluminum wires randomly distributed in plastic. The relation between Deff and DI can be obtained by a random walk argument due to Hart." Assume that each atom makes n jumps in a pure metal single crystal containing many randomly oriented dislocations. Ignoring correlation effects and assuming all jumps are of length r, the net displacement for each atom after n jumps is R, and the average displacement
 204 Diffusion in Solids
R2, = nr2 (6-12) Now of the n jumps taken by an atom n1 were in the lattice and np in dislocation pipes. The jump frequencies inside and outside the dislocation are defined as
tP F = n p and ti = ni
where n =- np + n1, tp and t1 are the times spent in the dislocation and
lattice respectively, and t = tp + t1. Eq. (6-12) can then be rewritten
Rti
(6-13)
| t |
P = to r. _
I r Except for a geometric constant, Rn2/t equals Deff; and except for the
same constant, Fp r2 and TI r2 equal Dp and D1, respectively. Thus Deff for a single crystal is
Deff gDp + D1(1-g)' D1(1 + g(Dp/D1)) (6-14)
where g = tp/t. For a pure metal g is (a/Z)2, or the fraction of atoms in the pipe. Some straightforward arithmetic indicates that if Dp/D, = 107 then the dislocations in an annealed crystal (106/cm2) have a negligible effect on Der, but if the dislocation density is increased a hundred fold by slight cold working, Deff is increased significantly. For the diffusion of a solute that tends segregate to the dislocation, g = K(a/Z)2.
(b) In this case there is a region well below the surface in which the lattice around each dislocation pipe contains solute which entered by diffusion along the dislocation, that is VD7t a. However, these solute fields do not overlap with one another because, //71t < Z. Thus a semilogarithmic plot of the average concentration e(y) in a section at a depth y beneath the surface will show two regions. Near the surface where lattice diffusion is dominant ln(C) is proportional to y2 and the line has a slope (-1/4D1t). Beneath this at a depth of say y > 5\/D 1t, ln(C) is proportional to y (not y6/5 as in the case of grain boundary diffusion) and the slope is given by
d ln(C)Idy = Ana(Dp/D1)1/21 with A ~ 0.8 (6-15)
This slope is independent of time, in distinct contrast to the case for a tail due to grain boundary diffusion (see Eq. 6-6). Also, the slope is independent of: the density of dislocations, and whether the surface concentration is held constant or a thin film is applied. However, the intercept of a plot of In (c) vs. y extrapolated to y =-- 0 would depend on each of these variables.


 200 300
Y (pm)
Fig. 6-12—Penetration curve for Na* into an NaC1 single crystal showing a tail due to diffusion along dislocations. (Y. K. Ho, Thesis, Imperial College, London, 1982. See LeClaire & Rabinovitch)
Fig. 6-12 shows two penetration plots for a Na tracer diffusing from a thin surface film into pure NaC1 single crystals in the low temperature (extrinsic) range. Note that the linear plot fits the data quite well, and that increasing the time by a factor of 4 does not change the slope. Both of these observations confirm that the tail is due to separate dislocations not dislocations aligned in low angle boundaries. Ho also treated the contribution of these dislocations to the electrical conductivity and found that
= (F2D/RTf)Tr[a2(Dp/Di)ld (6-16)
where d is the dislocation density. This adds one more mechanism to the list of possibilities that can influence o- and D in the Extrinsic range.
(c) Here the solute all stays in the dislocation pipes, and er(y,t) is obtained in the same way used in Chap. 1 with Dp replacing D.
 6.4 DIFFUSION ALONG MOVING BOUNDARIES
Our treatment of grain boundary diffusion has been limited to stationary grain boundaries. There the transport from the surface into the lattice is aided by boundary diffusion, but ultimately limited by diffusion through the lattice. However, if the boundary moves as diffusion occurs, the rate of mixing from the surface into the lattice is greatly increased. Recently it has become clear that in samples containing strong concentration gradients diffusion along existing grain boundaries can induce the boundaries to move, and even induce nucleation and growth of new grains. The difference in the degree of mixing of solute in the two cases can be profound. The difference in solute distribution between stationary and moving boundaries is indicated in Fig. 6-13. There at the boundary that has not moved the solute enriched layer is deep and very thin. The solute enrichment behind the boundary that has moved is somewhat more shallow, but orders of magnitude wider.
The sort of behavior shown in Fig. 6-13 is not found when the concentration difference between the surface layer and bulk is small, but is quite common if the concentration is large. It is called, Diffusion

Fig. 6-13—Cross section of sample containing two grain boundaries after exposure of the upper surface to a solute vapor. One boundary has exhibited DIGM along a portion of its length, one has not. The shaded area reflects the relative volume of solute enriched matrix around the two boundaries.
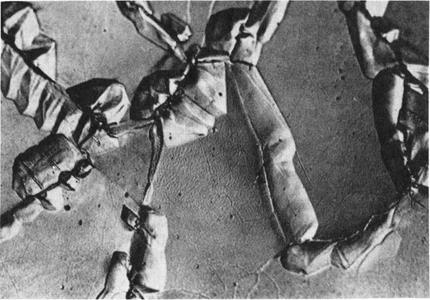

 Fig. 6-14—Photomicrograph illustrating the surface relief accompanying the local zincification of an iron foil 40 microns thick by DIGM. [M. Hillert, G. Purdy, Acta Met. 26 (1978) 333.]
Induced Grain-boundary Migration (DIGM). One of the systems which easily exhibits DIGM is Fe-Zn. Fig. 6-14 shows the surface of a sample which has undergone DIGM. The regions high in Zn show up along the original boundaries in relief and contained 6-7% Zn through the entire thickness of the foil. The remaining part of the grains showed no increase in Zn aside from a surface layer about 0.1 urn deep formed by lattice diffusion. The solute rich regions shown in Fig. 6-14 formed both by the movement of existing boundaries, and the nucleation and growth of new grains.
Questions concerning DIGM can be grouped in three categories: what happens, why, and when? The first has been touched on above, and will be described further below. As for `why?', DIGM is driven by the free energy of mixing solute into the lattice. There is no general agreement on how this free energy couples to the boundary to move it, and indeed there may be several mechanisms operating at different times and in different systems.15 The central point for our purpose is that DIGM can occur in alloy systems, and when it does, it will greatly increase the apparent D.
The question of when DIGM occurs has several types of answers:
• DIGM has been observed in essentially all binary alloys where it has been looked for. It has been reported in a few binary ceramic systems, but has not been found in most ceramic systems investigated.
· 


 DIGM has been reported to occur over a range of temperatures up to almost the melting point, but the effect is most pronounced and important at low temperatures.
· Only high angle boundaries exhibit DIGM. This may be due to their higher values of Db, but probably has more to do with their ability to generate the many new sites needed to incorporate the solute into the alloy lattice.
· The movement is not continuous in time for a given boundary, but may stop and start again, may stop and then reverse, or may stop and not start again.
· The rate of both nucleation and growth increases as the Ac across the boundary increases.
Дата добавления: 2015-10-29; просмотров: 163 | Нарушение авторских прав
| <== предыдущая страница | | | следующая страница ==> |
| TILT ANGLE 8, deg | | | SURFACE DIFFUSION AND SHAPE CHANGE |