Читайте также:
|
Variance is a statistical measure that tells us how measured data vary from the average of the set of data.
Standard deviation is a measure of the variability or dispersion of a data set. A low standard deviation indicates that all of the data points are very close to the average, while high standard deviation indicates that the data are “spread out” over a large range of values.
In addition to expressing the variability of a population, standard deviation is commonly used to measure confidence in statistical conclusions.
In manufacturing, it is necessary to control the amount that a process varies. For instance, a cabinet shop will make hundred of similar cuts in the manufacturing process. It is important that the lengths of the cuts vary little or not at all to insure the construction in beautiful sets of cabinets.
Degrees of freedom is used to describe the number of values in the final calculation of a statistic that are free to vary.
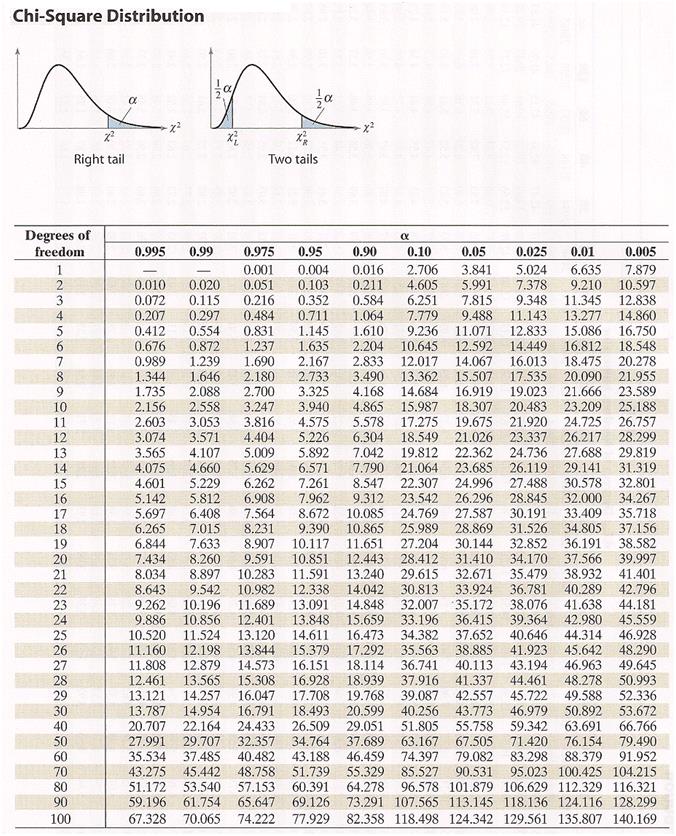
Chi-square distribution is used to measure the amount of variation that exists in a population.
The point estimate for the population’s variance σ2 is a sample’s variance s2.
The point estimate for the population’s standard deviation σ is a sample’s standard deviation s.
Chi-square distribution is a family of curves that are skewed positively. Each uses a degree of freedom that is equal to one less than the size of the sample. d.f. = n – 1
Degrees of freedom is used to describe the number of values in the final calculation of a statistic that are free to vary.
The area under each curve equals one.

There are two critical values for each level of confidence. The value  represents the right-tail critical value and
  represents the left-tail critical value.
The table gives areas that represent the regions under the chi-square curve to the RIGHT of the critical value. This means these values are right tail values not at all like the normal distribution z table we used earlier.
Example. Find the critical values χ2R and χ2L for a 95% confidence interval when the sample size is 15.
Because the sample size is 15, there are 14 degrees of freedom.
The area to the right of χ2R

The area to the left of χ2L
Using 14 degrees of freedom and the areas 0.025 and 0.975, you can find the critical values.
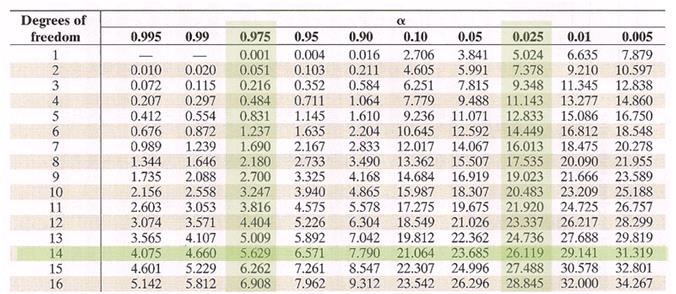
From the table, you can see that χ2R = 26.119 and χ2L = 5.629.
.
We will use these critical values χ2R and χ2L to construct a confidence interval for a population’s variance and standard deviation.
A c-confidence interval for a population’s variance and standard deviation are determined from the following intervals:
for a population’s variance 
for a population’s standard deviation 
The probability that the confidence interval contains σ2 or σ is c.
Guidelines
1. Verify that the population is normally distributed.
2. Identify the degree of freedom.
3. Find the point estimate s2.
4. Find the critical values and that correspond to the given level of confidence.
5. Find the left and right endpoints and form the confidence interval for the population’s variance and population’s standard deviation.
Example: You randomly select 30 pieces of trim that has been cut in a cabinet shop. The sample standard deviation is 1.2 millimeters. Assuming the lengths are normally distributed, construct 99% confidence intervals for the population variance and standard deviation.
Critical values…
n = 30
d.f. = 29
Area to right = 0.005
Area to left = 0.995

From the table, χ2R = 52.336 and χ2L = 13.121.
Using these critical values and s = 1.2, here’s how we find the confidence interval for σ2.

The confidence interval for σ2 is (0.7979, 3.1826)
The confidence interval for σ is  = (0.8933, 1.7840).
So with 99% confidence, we can say that the interval (0.7979, 3.1826) contains the population’s variance. And with the same 99% confidence, we can say that the interval (0.8933, 1.7840) contains the population’s standard deviation.
Дата добавления: 2015-10-29; просмотров: 127 | Нарушение авторских прав
| <== предыдущая страница | | | следующая страница ==> |
| Последовательность действий при формировании программ(ы) экологического менеджмента | | | Слова кролика |