|
Читайте также: |
Ex. 1 Questionnaire. Student priorities
Over the next fifteen years, which of the following values in life are priorities for you? Fill in the questionnaire for yourself, then find the averages for your class.
Show your priorities by writing in a number from 0 to 3.
My own personal development
Developing a career
Time with close friends/relatives
Having a family
Rewarding leisure/travel
Gaining international experience
Exercising and personal fitness
Developing creative/ artistic talents
Starting my own business/company
Giving time to non-profit organisations
Another priority
Ex. 2 Compare future-oriented priorities of young people with those of actual full-time workers. Read the newspaper editorial about a recent survey in Britain.
ALL WORK, NO PLAY
We've got the balance wrong
It began life inside the American expression “gettalife”. Since then the word has developed a life of its own – as used by the stressed workaholic who sighs, “I have no life”. In this new context the word refers to those rare moments of genuine living, to those fleeting seconds of “quality time”. It can be spent anywhere – just so long as it's away from the office or the factory.
The conflict between life and work is laid bare in a survey published this morning by Management Today magazine. It makes for compelling and timely reading. The survey reveals that employees across Britain, male and female, are cracking under the stress of work overload.
More than half of respondents report spending between 41 and 50 hours a week at work, with a further 25% staying in the office for more than 51 hours. Close to half say they find it increasingly hard to reconcile their work with their personal commitments. Fascinatingly, a quarter says they would accept less money in return for more time.
There is a time famine out there, and British workers are among the hungriest. Management Today has called its report The Great Work/Life Debate, acknowledging the two are now in permanent conflict. It's a useful contribution, for that's exactly what's needed: a great debate about the way changes in technology and the labour market have transformed the way we all work – and try to live.
The Guardian
Ex. 2.1 Look through the article and put the expressions under the appropriate heading “ Life” / “Work”: rare moments, stressed workaholic, genuine living, no life, fleeting seconds of quality time away from the office or factory, cracking under the stress, work overload, personal commitments, time.
Ex. 2.2 The survey mentioned in the editorial identified ten things that people in full-time work most desired, and ten things that they regretted and felt that they had to sacrifice. Can you guess what the ten things are in each list? Write as many ideas as you can on the board. Then look at the “Wishes and Misses”.
Wishes and misses
The top ten desires identified by the survey were:
1. Being able to work fewer hours
2. A change in the company culture
3. Work flexible hours
4. Reduce commuting - or avoid it
5. Work from home
6. Change jobs or relocate
7. More staff
8. Earn more
9. Retire
10. Reduce stress
Top ten sacrifices identified by the survey:
1. Missing out on children growing up
2. Putting work before home and family
3. Moving home for employer
4. Missed leisure/hobby time
5. Away from home - short term
6. Divorce/strain on the relationship
7. Away from home - long term
8. Time spent on work-related education
9. Not having/postponing children
10. Unable to form relationships
The patterns of employment. Workforce
Social classes
The Institute of Practitioners In Advertising (IPA) define six social classes, based on the occupation of the head of household
Class Occupation
| A | Higher managerial, administrative, or professional |
| B | Intermediate managerial, administrative, or professional |
| C1 | Supervisory or clerical, junior managerial, administrative, or professional |
| C2 | Skilled manual workers |
| D | Semi and unskilled manual workers |
| E | State pensioners, casual or lowest grade workers, or long-term unemployed |
People are employed in the three sectors mentioned in unit 9: primary, manufacturing and service. Employment is also often divided into sections according to types of work and social class. These categories include professional, manual and non-manual. A doctor, for example, would be classed as a professional in the service sector, while a steelworker would be a manual worker (skilled or unskilled) in the manufacturing sector. The old distinction between white-collar (non-manual) and blue-collar (manual) workers has become less clear as heavy industry has declined and new technology has become more important. In general, one trend is very clear: fewer people now make cars or work in coal mines; more work for banks and hotels.
By the year 2000 Britain's working population – the workforce – was 27 million (nearly 50 percent of the total population). Those in employment include
full-time, part-time and self-employed people.
In 1951 96 per cent of the people in work in Britain had full-time jobs and the majority of these (70 percent) were held by men. By 2000 21 percent of jobs were part-time and 44 percent of workers were women. The basic employment trend of the 1980s continued, with a general rise in the number of part-time jobs for women, particularly in service industries. The number of people who were self-employed also rose due partly to new technologies and to changing work patterns. As well as regional and occupational variations there are big differences in pay between men and women. The average full-time wage for women is still only 80 percent of the male average, even when the same job is involved.
Certain highly-paid occupations such as surgery are still almost exclusively confined to men.
Fig. 1. The working population
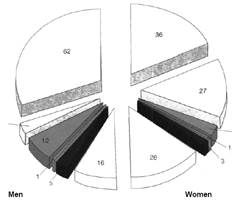
Percentages
62/36 Full-time employees
5/27 Part-time employees
12/5 Self-employed
1/3 On government schemes
5/3 Unemployed
16/28 Not looking for work
Дата добавления: 2015-10-24; просмотров: 128 | Нарушение авторских прав
| <== предыдущая страница | | | следующая страница ==> |
| This article provides a checklist for employment matters. | | | Employment Trends |