|
Читайте также: |
April 13th, 2005
n a continuation from the previous tip, we look at some basic built-in functions for determining trendline coefficients of a X-Y plot.
For a series of X-Y values that we suspect have a linear relationship, we can determine the slope and y-intercept values of the linear approximation using the builtin functions SLOPE() and INTERCEPT as showb below. Compare these values to those we obtained when performig our regression analysis without using the builtin functions.

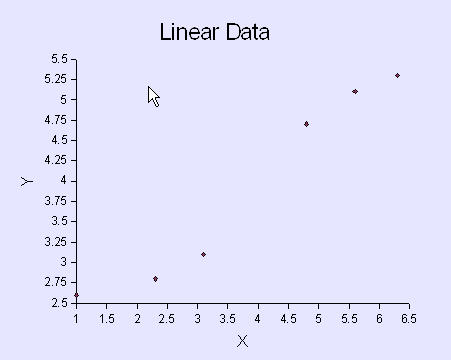
Now, plotting X-Y data is straightforward. Adding a trendline takes a little more work. We start off with the basic X-Y plot.
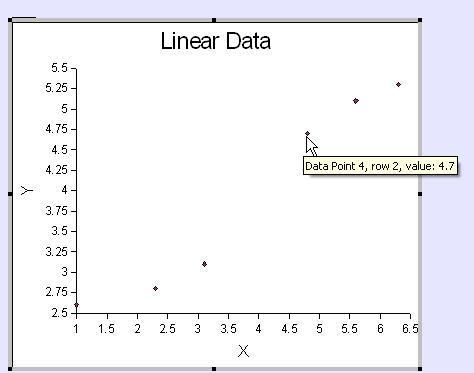
First, select the chart for editing by right-clicking anywhere inside the chart boundary. Now, before we add the trendline, we need to select the data series for editing. Move the cursor over one of the data points - you will see popup info about the nearest data point.
Left-click and the data series is now selected (below)

Now right-click and select Object Properties (below)

The Data Series dialog opens up. Select the Statistics tab (below). Select the Linear Regression curve and click OK

The modified X-Y plot with the newly added trend line.

Posted in Math & Statistics | 1 Comment»
Дата добавления: 2015-08-03; просмотров: 64 | Нарушение авторских прав
| <== предыдущая страница | | | следующая страница ==> |
| Regression analysis I : Basic linear formulas | | | Regression Analysis III : LINEST |