Читайте также:
|
Texts 3-3 (pages 70 - 72)
1. In what way is it more suitable to learn the equilibrium price and quantity?
2. At what prices are quantities demanded larger according to figure 3 – 1?
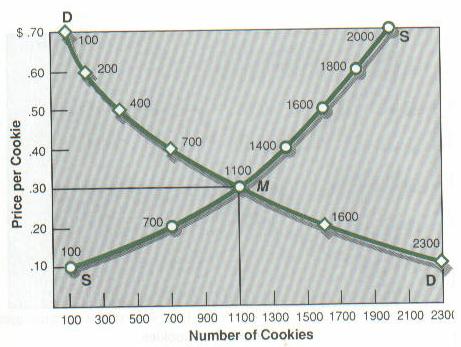
3. What demand/supply can be analyzed examining figure 3 – 3?
4. What’s the reason of not being forced to participate in a market?
5. How do sellers response to unsold stocks?
Figure 3 - 4
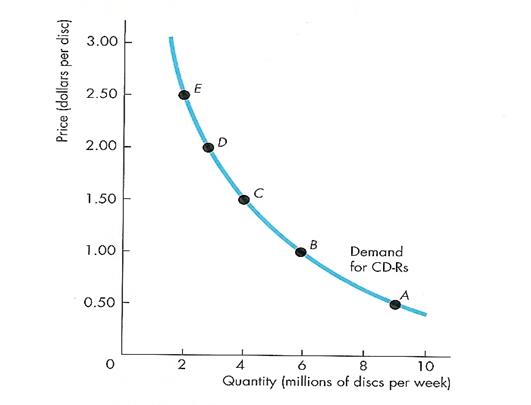
1. We graph the demand schedule as a demand curve with the quantity demanded of CD-Rs on
2. The points on the demand curve labeled A through E represent
3. Point B on the graph represents a quantity demanded of 6 million CD- Rs a week
4. If a small quantity is available, the highest price
5. As the quantity available increases, the marginal benefit of each additional unit falls and
A. the rows of the supply schedule.
B. the y -axis and the price of a CD-R on the x -axis.
C. at a price of 1.50 $ a disc.
D. the highest price that someone is willing and able to pay also falls along the demand curve.
E. that someone is willing and able to pay for one more unit is high.
F. at a price of 1$ a disc.
G. the rows of the demand schedule.
H. the x -axis and the price of a CD-R on the y -axis.
|
|
|
The demand curve shows the relationship between quantity demanded and price, everything else _____ 1 _____ the same. The demand curve _____ 2 _____ downward: As the price decreases, the quantity demanded _____ 3 _____. The demand curve can be read in two ways. For a given price, the demand curve _____ 4 _____ us the quantity that people _____ 5 _____ to buy. For example, at a price of _____ 6 _____ a disc, the quantity demanded is 4 million discs a week. For a given quantity, the demand curve tells us the maximum price that consumers are _____ 7 _____ and able to _____ 8 _____ for the last discs _____ 9 _____. For example, the _____ 10 _____ price that consumers will pay for the 6 _____ 11 _____ disc is $ 1.00.
Use TRUE if the statement agrees with the information
FALSE if the statement contradicts the information
NOT GIVEN if there is no information on this
Choose the correct letter A, B, C or D.
A. The table is more convenient to read than the diagram.
B. What do the demand/supply curves show.
C. The price of the good and the quantity relationship in a diagram form.
D. When market equilibrium occurs.
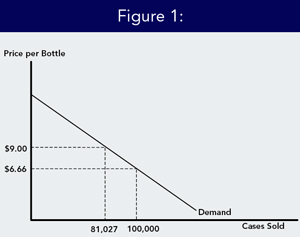
The first step to understanding and analyzing the effect of promotion is to consider how promotion affects sales and revenue. The goal of promotion is to attract consumers and convince them to buy your wine over another's. Since promotion affects the demand for your wine, it is important to have a firm understanding of what the demand for your wine represents. To illustrate how promotion affects sales and revenue, we estimated the demand function for California Cabernet Sauvignon. A simplified representation of the demand for this wine is shown in Figure 1. …
| demonstrates sold the greater | between and the quantity | the demand curve the higher the lower | the relationship price units |
Figure 2

Figure 3
Дата добавления: 2015-10-28; просмотров: 110 | Нарушение авторских прав
| <== предыдущая страница | | | следующая страница ==> |
| Check your progress | | | Статья 16. Недействительность условий договора, ущемляющих права потребителя |