|
Читайте также: |
Laboratory work № 6
Elements of metrological certification of measuring instruments for compliance with technical standards
Work goal
1.1. The study of the basic concepts of certification tests of measuring instruments (MI).
1.2. The formation of skills of determining the structure of the MI error for all numerical scale markings.
1.3. Mastering the skills of metrological certification of MI, in a separate division of the scale in the particular conditions.
Main principles
Basic concepts of product certification
Certification in translation from Latin means "is done right."
Certification – is the process by which a third part gives written assurance that a product, process or service fulfills specified requirements.
Certification is considered the basic concept of reliable proof of correspondence of production (process, service) to specified requirements. Generally accepted concept of such proof is the certification of compliance.
Certification of compliance through certification provides mandatory involvement of the third part. This certification of compliance is independent and runs on rules of certain procedure; it ensures compliance with specified requirements.
Certification of compliance – is an action of testing laboratory of a third part, which proves, that a particular sample corresponds the specific standard or other normative document.
Procedures, regulations, testing and other activities that can be considered as part of the process (activity) of certification can be different depending on several factors. Among them - the legislation on standardization, quality and certification directly; features of the object of certification, which in turn determines the selection of the test method, etc. In other words, the proof of compliance is carried out by one or the other system of certification.
In correspondence with ISO / MEK documents, the certification system - is a system that has its own rules, procedures and management for carrying out certification of conformity. It can operate at the national, regional and international levels.
If the system of certification is engaged in proof of compliance of certain type of product (process, service) – it is a system of certification of homogeneous product (certification program, certification scheme), which uses in its own practice standards, rules and procedure that are specific to the product.
A systematic review of the degree of compliance with specified requirements is called conformity assessment. More common notion of conformity assessment is regarded inspection, which is considered as the conformity assessment by measuring the specific characteristics of the product.
Measuring instruments and their metrological characteristics
Measuring instruments (MI) - are the technical tools used in the measurements and which have normalized metrological characteristics (NMC). MI are divided into measures, measuring devices, measuring transducers, auxiliary measuring facilities, measuring units and measuring systems.
Measure – is a measuring instrument that reproduces the physical quantity of a given size.
Measuring devices - are measuring instruments that are designed to produce the signal of measured information in a form accessible to direct perception of the observer.
All measuring instrument s have certain metrological characteristics. Measures are characterized by the nominal and actual values. Nominal value of the measure - is the value of quantity indicated on the extent or attributed to it. The actual value of the measure – is a real value, which is reproduced by measure.
Measuring devices consist of a sensor, which is under the direct influence of the physical quantity, measuring unit or a readout device. Readout device has a scale and a pointer, which is in the form of the material rod-arrow, or as a ray of light - a light pointer. The scale has a set of marks and affixed around some of them numbers of count that correspond to a set of consecutive values of the quantity.
Scale interval – is a difference of values of the quantity that corresponds two neighboring scale marks. Sensitivity of device is defined as the ratio of the output signal of the device to its induced changing of measured value.
Initial and final value of the scale - is the smallest and largest value of measured quantity, which is defined on the scale.
Measurement range - is the range of the measured value, for which normalized errors of device are allowable. Measuring limits are the greatest or the least value of the measuring range.
The variation of parameters – is a difference of device’s parameters which correspond to a given point in the measurement range at two directions of slow measurements of device’s parameters.
Measuring stability - is the quality of measuring instrument that displays unchanging over time of its metrological characteristics.
Accuracy class of MI – is a summarized its characteristics, determined by the boundaries of acceptable and additional errors, and other properties of the measuring instruments. Accuracy class, although characterizes a set of the metrological characteristics of the given measuring instrument, but does not uniquely determine the accuracy of the measurement, since the latter depends on the measurement method and the conditions of their implementation.
Technical errors of measurements
Measurement errors arise from the imperfection of the methods and measuring instruments, influence of measurement conditions and the imperfection of the senses of the observer, and also many other factors that give the total measurement error. All of these factors can be grouped into two main groups:
Random errors (including gross errors and failures) which cannot be predicted during repeated measurements of the same quantity.
Systematic errors, that remain constant or change regularly during repeated measurements of the same quantity.
Random error cannot be excluded from the results of measurements, but its influence can be reduced due to repeated measurements of the same quantity and processing of the experimental data.
To assess the possible measurement errors it is necessary to know the pattern of occurrence of random errors. With a significant number of measurements their values, as a rule, are distributed due to the Gaussian law (normal distribution):
- measurement errors can take a continuous range of values; the probability (frequency) of the appearance of errors, equal in value and opposite in sign, is the same;
- large in absolute quantities errors occur less than small;
- average arithmetic error approaches to zero at the increasing number of measurements.
Gross errors and failures occur because of errors or wrong actions of performer (his psycho physiological state, incorrect readout, writing or computing errors, wrong inclusion of devices, etc.), and also at short-term changes in the measurement conditions (vibration, admission of cold air, instrument pushing by performer, etc.).
If gross errors and failures are found during the measurements, then measurement results are discarded and additional measurements take place. However, it is necessary to keep in mind that unreasoned kick of results that are very different from the other, can lead to a significant distortion of the dissipation characteristics of a set of measurements, because repeated measurements is best to be done as an addition to them. But more often they are discovered only at the final processing of measurement results using special criterions of estimation of gross errors.
To prevent gross errors and failures, one practices carrying out of parallel computing, and sometimes the analysis by two performers.
Systematic errors are definite functions of non-random factors, structure of which depends on the physical, constructive and technological features of the measurement, the conditions of their using, as well as the individual qualities of the observer.
Complex deterministic laws, that govern the systematic errors, are determined either during creating of measurement instruments and a complectation of measuring equipment, or directly in the preparing of measuring experiment and during the event.
Metrological certification of MI
2.4.1. MI at the release into circulation, as well as periodically during the process of exploitation, is a subject of metrological certifications.
Metrological certification - is a researching of MI, which are not a subject of state tests in order to determine their metrological characteristics and issuance of a correspondent document according to a State Standards of Ukraine (USST). One of the main problems of such a researching is to determine the structure of MI error in all digitized scale marks.
During single measurements estimation of error is performed on the basis of the accuracy class of the MI, which is used for this purpose.
The result of the measurement x in this case is possible to write only in the form of:
 (2.1)
(2.1)
where a - indication of MI,  – allowable absolute error.
This note indicates that the value of measured value is within:
Therefore, the boundary of allowable error of MI incompletely characterizes the quality of measurements: only uncertainty of a measurements, and the true values of the measured quantity and the law of probability distribution of real error within these boundaries for a particular instance of MI remain unknown; it is unclear which of the components (systematic  or random
  ) dominates in the sum
 (2.2)
(2.2)
Thus, showing the boundaries of the measured value based on the accuracy class of the MI does not detect the internal structure of the real measurement error, which is necessary for metrological certification. At certification of measuring instruments in accordance with SST one turns to multiple observations and subsequent statistical analysis of their results.
2.4.2. The structure of the error at each point of the scale of MI is completely characterized by the probability density function or a function of the probability distribution of error. Probability density function, as known from higher mathematics course, has a set of numerical characteristics, each of which has its own meaning. More often as such numerical characteristics is used the first two moments of the density distribution probabilities - mathematical expectation of errors M[Δ], which are the systematic component of the error SI and the dispersion D (or the average deviation of the random component of
Approximate values of the numerical characteristics of the distribution, obtained from a limited number of observations, are called estimations of the true values of these numerical characteristics, for example experimental. Estimations, in contradistinction to the true values of the numerical characteristics, are, in turn, random variables, which are characterized by their own laws of distribution.
Determination of density estimation of the probability distribution (histograms) on the basis of experimental data requires several hundred observations. The determination of the of the estimation of numerical characteristics can be done at a much smaller number of observations n = 10... 20. Value n depends on the required accuracy of the determination of estimations. The specific value n is regulated in the "Test Methods" of technical standards for various types of measuring instruments. In the learning laboratory work the number of experiments n to be agreed with the teacher and may be less than 10 measurements.
2.4.3 In some MI, for example, in digital, there is a pronounced hysteresis. This means that at comparing of this MI with model, indications of the latter depend in which side the value of the measured quantity changes at the approach to the researching point - downward or upward.
The difference between the indication of reference MI  , received at the approach to the given point of the MI scale from the side of smaller values, and the indication
  , obtained at the approach to the same point from the side of high value that is measured is called the variation of MI indications at a given point of scale a:
 (2.3)
(2.3)
2.4.4. Let’s consider one of the procedures of the determination of estimations of the basic numerical characteristics of error at the point of the scale, when the error of model MI can be neglected.
Initial experimental data for determining the statistical characteristics of the MI errors (device, whole measurement system, separate measurement transmitter) get through carrying out its tests. During tests model and investigated MI are connected simultaneously to the source of the measuring signal with smoothly regulated parameters. By known allowable way we can eliminate systematic errors of the testing MI. Then multiply (n times) changing the regulated parameter, one sets the pointer of investigated device on selected digitized mark of a MI scale. Next, step by step, one performs the operations described below.
Step 1. Get a statistical series for the selected digitized mark of MI, which is used by multiple repetitions of observations, setting an indication of the lower values
 ...,
...,  (2.4)
(2.4)
Calculate the average value of:
Step 2. Receive statistical series for the same numerical mark of MI, which is used, but an indication is installed from the side of large values
 …,
…,  . (2.5)
Calculate the average value of:
The next steps involve calculations.
Step 3. Calculate the absolute errors  for the series (2.4):

 ,
,
……………
Step 4. Calculate the absolute errors  for the series (2.5):
 ,
,
……………
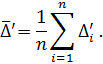
Step 5. Calculate the average value of the series (2.4):
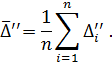
Step 6. Calculate the average value of the series (2.5):
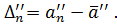
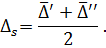
Step 7. Calculate estimation of non-exclusion remainders of systematic error component:
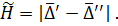
Step 8. Calculate hysteretic:
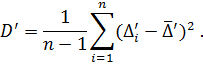
Step 9. Calculate estimation of dispersion of results’ deviation observations from  for the series (2.4):
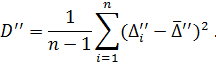
Step 10. Calculate estimation of dispersion of results’ deviation observations from  for the series (2.5):
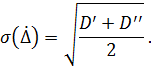
Step 11. Calculate estimation of root-mean square (RMS) deviation of random error component:
Step 12. Determine the confidence interval of dispersion measurements result. The confidence interval is a non-random interval in which the estimation of the dispersion will be on a given confidence P. The confidence interval can be calculated using the formula:
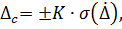
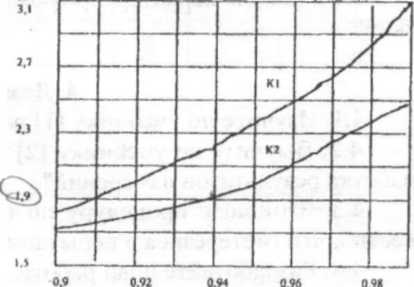 where the coefficient K is defined by recommendations of determination of confidence boundaries for the dispersion and root-mean square deviation for the assigned value of confidence P. Ρ-value is indicated in the technical standards for the device. A plot of dependence K (P) is shown on Fig. 1.
Curve K1 can be used for a normal distribution law of errors of MI at unlimited number of measurements. If number of measurements is limited and the distribution law of errors of MI can be referred to the number of symmetric distribution laws with not increasing density with deviation from the distribution center, then for determination of K the curve K2 is used.
Figure 1 – Plot of dependence  (P)
(P)
If the distribution law of error of MI can be referred to the number of symmetric distribution laws with not increasing density at deviation from the distribution center, then value of can be accepted instead of K.
2.4.5. MI tests are carried out in most cases by means of model measurement instrumentation that provides the greatest accuracy.
In the learning laboratory work, calibration and certification of the generator "Electronics", or any other, is carried out with a digital cymometer. It is possible, to carry out researching of voltmeters and other screens.
Дата добавления: 2015-10-26; просмотров: 211 | Нарушение авторских прав
| <== предыдущая страница | | | следующая страница ==> |
| Концентрации растворов | | | Qualitative reaction of lecithin with cadmium chloride. |