In brief
| T |
he Gapminder World graph is available on-line through links on the following pages. Project the graph for the class. The graph displays the level of development in three countries in the past.
Ask the students which of the three is the most developed today. Click play and the answer is revealed through an animation.
Pages 1 to 4 give additional details, but you can skip that and go directly to the quizzes on page 5 to 11.
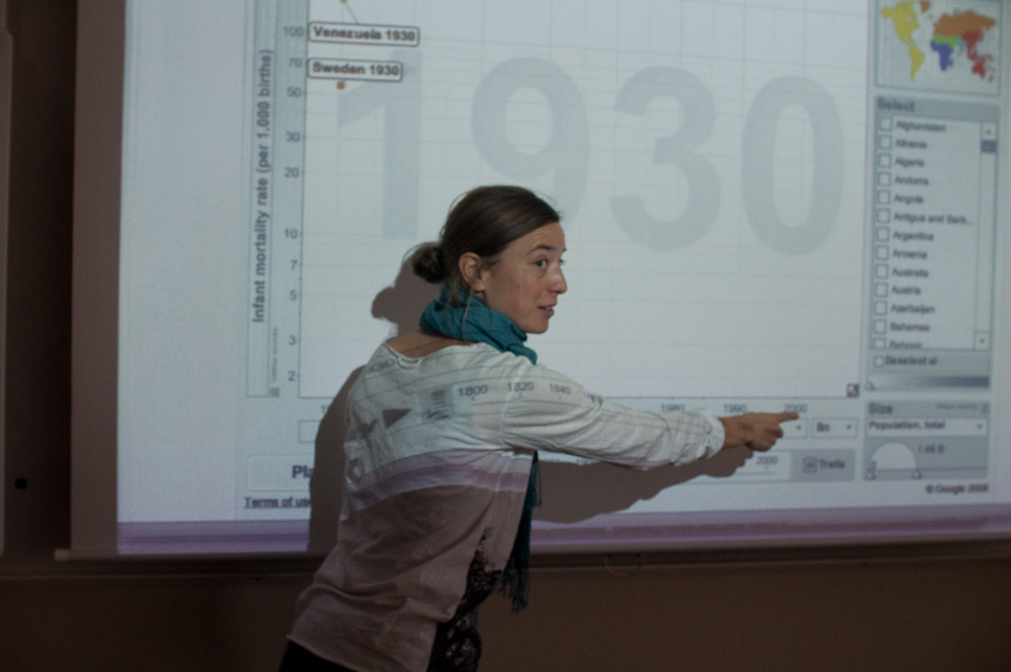 A teacher displaying the quiz graph for the first quiz question
How to use the quizzes in teaching
| A |
ll the quizzes can be used to stimulate the interest in using statistics to understand the world. The sometimes surprising answers contained in the quiz can challenge the students’ world view.
You can also use it to introduce more specific subjects, e.g. global health, the effects of HIV, population growth and carbon dioxide emissions. Furthermore, you can use it as starting point to discuss what development is. What do the indicators in these quizzes say about the world?
Several of the quizzes illustrate the so-called demographic transition: most countries in the world have gone from having many children and high mortality to few children and low mortality. You can do the quizzes related to fertility and mortality, and then move on to discuss the global pattern.
How to set up the game
You need a classroom with a computer and a projector. The graph is available on-line (see “About the Gapminder Graph”).
1. Preparations: In the quiz questions on page 6 to 12 you find a link to a graph. If you click on the link, a graph will open in your browser with everything set up for the specific quiz question.
You can open each quiz graph in a separate tab in your browser. Use control+tab to go between the quiz graphs in the browser. Click “full screen” for each tab. Divide the class into teams of 3-5 persons.
2. Display the first quiz graph and explain it. Explain that the bubbles represent countries and that the horizontal axis shows time. Then explain what the vertical axis shows (this axis changes with the different quiz questions.
Point at each country bubble and give a quick background information for each (just a sentence or so), e.g. where the country is located.
3. Ask the groups the quiz question.
4. Click play. The bubbles will start to move. Comment on the movements. Give one score to the groups that gave the right answer. Go to the next quiz graph.
There is also an “if students ask” box for each quiz. This is intended to help you answer questions from students, not for lecturing.
Дата добавления: 2015-10-29; просмотров: 89 | Нарушение авторских прав
| <== предыдущая страница | | | следующая страница ==> |
| ACUTE AND CHRONIC CHOLECYSTITIS | | | About the Gapminder World Graph |