|
Читайте также: |
About GetData Graph Digitizer
GetData Graph Digitizer is a program for digitizing graphs, plots and maps. Main features of GetData Graph Digitizer are:
| · | supported graphics formats are TIFF, JPEG, BMP and PCX; |
| · | two algorithms for automatic digitizing; |
| · | convenient manual digitizing; |
| · | reorder tool for easy points reordering; |
| · | save/open workspace, which allows to save the work and return to it later; |
| · | obtained data can be exported to the clipboard; |
| · | export to the formats: TXT (text file), XLS (MS Excel), XML, DXF (AutoCAD) and EPS (PostScript). |
License Agreement
GetData Graph Digitizer is distributed as try-before-you-buy software. Anyone may use this software during a test period of 21 days. Following this test period or less, if you wish to continue to use GetData Graph Digitizer, you must register.
The GetData Graph Digitizer unregistered shareware version may be freely distributed, provided the distribution package is not modified. No person or company may charge a fee for the distribution of GetData Graph Digitizer without written permission from the author.
THIS SOFTWARE IS PROVIDED "AS IS". NO WARRANTY OF ANY KIND IS EXPRESSED OR IMPLIED. IN NO EVENT WILL THE AUTHOR BE LIABLE FOR DATA LOSS, DAMAGES, LOSS OF PROFITS OR ANY OTHER KIND OF LOSS WHILE USING OR MISUSING THIS SOFTWARE.
Installing and using GetData Graph Digitizer signifies acceptance of these terms and conditions of the license.
Using
GetData Graph Digitizer
Step 1
| Open image file (File=>Open Image). |
Step 2
| Set the scale by setting four points Xmin, Xmax, Ymin and Ymax, and by assigning logical coordinates to these points ("Xmin value", etc.). To set the scale use Operations=>Set the scale menu or context menu (right mouse button). |
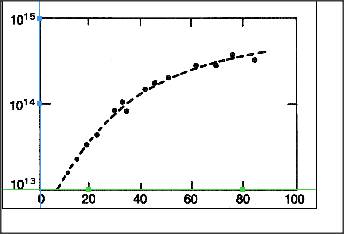
| Picture below illustrates how Xmin, Xmax, etc., can be set in the case of sample graph. Xmin and Xmax are assigned values 20 and 80 respectively, Ymin and Ymax are assigned values 1e+14 and 1e+15. The scale is logarithmic along Y axis, this can be set in "Adjust scale" window under Operations=>Adjust scale menu. |

|
Step 3
| Digitize graph. |
| Automatically digitize, using one of the two methods. |
| 1) Operations=>Auto trace lines. Choose starting point by clicking left mouse button, or right mouse button to additionally choose direction for line tracing. The same can be done through context menu ("Auto trace lines" item). |
| 2) Operations=>Digitize area. First you will be asked to set grid type, distance between grid lines, and other options. Then choose the area to digitize by holding left mouse button and dragging the grid (in case of rectangular grid hold down Shift to rotate the grid). You can move the grid by holding down Ctrl. |
| Manually digitize, using point capture mode (Operations=>Point capture mode). In this mode data points can be also moved; to move a point first select it with right mouse button, and then set it at a new location by left button. Data points can be also set by double clicking left mouse button in Magnifier window, or Shift + clicking in main window or in Magnifier window. To remove points it is convenient to use eraser tool (Operations=>Data points eraser). |
Step 4
| Copy obtained data to the clipboard (File=>Copy data to buffer or Ctrl+Alt+C) or export to one of the following formats: TXT, XLS, XML, DXF or EPS (File=>Export data). Data can also be copied to buffer directly from Information window (Ctrl+C or Ctrl+INS). |
| Settings for export to the buffer and for export to the text file can be changed in the "Options" window under Settings=>Options menu. Use File=>Open Image to open an image. Supported formats are TIFF, JPEG, BMP (Windows and OS/2; 2, 16, 256 and 16M colors), and PCX (2, 256 and 16M colors). If your graph is in different format, you will have to convert it. Two possible choices of image viewer/converter program are XnViewand IrfanView. opening image To convert from PS, EPS or PDF format. Open file using GSview (http://www.cs.wisc.edu/~ghost/). For GSview version 4.3 and above: go File=>Convert and choose one of the following devices: bmpmono, bmp256, pcxmono, pcx256, jpeggray, jpeg. For previous versions the same functionality is available under File=>Print menu. To convert from DOC file (Microsoft Word). Open file in Microsoft Word, then select the graph and copy it to the buffer. Next it can be pasted into a new file, for example using XnView (File=>Import Clipboard |
Opening and Saving Workspace
GetData Graph Digitizer can save current workspace to the file (File=>Save Workspace). This allows you to save your work, and return to it later. Workspace files are saved in XML format. Please note, that workspace file does not include original image, but only link to the file (path and file name).
Setting Scale
In order to obtain logical coordinates of data points (i.e. to digitize the graph), one has to set the scale. Scale is defined by setting four points Xmin, Xmax, Ymin and Ymax, and by assigning logical coordinates to these points ("Xmin value", etc.). This method allows to digitize graphs with any layout of axis, including cases when axes are not orthogonal (this is the case for the graph in sample3.pcx).
To set the scale use Operations=>Set the scale menu or context menu (right mouse button). You can also set default axes (Operations=>Set default axes), in this case all coordinates will be just image pixels.
Picture below illustrates how Xmin, Xmax, etc., can be set in the case of sample graph. Xmin and Xmax are assigned values 20 and 80 respectively, Ymin and Ymax are assigned values 1e+14 and 1e+15. The scale is logarithmic along Y axis, this can be set in "Adjust scale" window under Operations=>Adjust scale menu. The same dialog allows to change Xmin, Xmax, Ymin and Ymax values at any time.
|
Digitizing
Automatically digitize
| GetData Graph Digitizer includes two algorithms for automatic digitizing. |
| Auto trace lines |
| This method is designed to digitize solid lines. Choose the starting point, and the program will trace the line, stopping at it's end. To trace the line use Operations=>Auto trace lines menu or context menu ("Auto trace lines" item). To choose starting point click left mouse button, or click right mouse button to additionally choose direction for line tracing. |
| Digitize area |
| This method works for any type of lines, including dashed lines. Depending on current settings (Settings=>Options=>Digitize=>Digitize area) data points are set at the intersection of grid with the line ("in the middle of the line") or with the boundary of the area ("at the area boundary"). You can choose the type of grid (X grid or Y grid), and set the distance between grid lines. You can also make the grid be shifted in such a way, that it will pass through a specific X (or Y) value. To digitize area use Operations=>Digitize areamenu. First set grid type, distance between grid lines, and whether to shift the grid or not. Then choose the area to digitize by holding left mouse button and dragging the grid (in case of rectangular grid hold down Shift to rotate the grid). You can move the grid by holding down Ctrl. |
| Both algorithms make use of line and background colors (displayed in the Information window). These colors are set automatically when image is loaded. To change them after image is loaded one can use Operations=>Set line color and Operations=>Set background colormenu items, or use "Set line color" and "Set background color" items of context menu (right mouse button). |
| "Line/background identification method" option in the Settings=>Options=>Digitize window allows to change the way program distinguishes between line and background. Use "by color" setting for lines with definite color, "by intensity" for black and white images; "combined" works rather well for all images. |
Дата добавления: 2015-10-31; просмотров: 86 | Нарушение авторских прав
| <== предыдущая страница | | | следующая страница ==> |
| Reviewed by Richard Patterson | | | Manually digitize |