Студопедия
Случайная страница | ТОМ-1 | ТОМ-2 | ТОМ-3
АрхитектураБиологияГеографияДругоеИностранные языки
ИнформатикаИсторияКультураЛитератураМатематика
МедицинаМеханикаОбразованиеОхрана трудаПедагогика
ПолитикаПравоПрограммированиеПсихологияРелигия
СоциологияСпортСтроительствоФизикаФилософия
ФинансыХимияЭкологияЭкономикаЭлектроника

Chapter 5

Читайте также:
  1. Chapter 1
  2. Chapter 1
  3. Chapter 1
  4. Chapter 1
  5. Chapter 1 Buried Hopes
  6. CHAPTER 1. A. A. Tkatchenko
  7. Chapter 1. The Fundamentals of the Constitutional System


  1. List and explain in detail four determinants of the price elasticity of demand.


  1. Consider the following pairs of goods. Which would you expect to have the more elastic demand? Explain each of your answer in detail.

a. water or diamonds

b. insulin or nasal decongestant spray

c. food in general or breakfast cereal

d. gasoline over the course of a week or gasoline over the course of a year

e. personal computers or IBM personal computers


  1. You are the owner of the Canteen on campus in SDU, and you know that the price elasticity of demand for your pizza is 0.5. What will happen to your total revenue from your pizza sales if you raise your prices? Prove your answer on the graph.

23. Use the graph shown to answer the following questions. Put the correct letter in the blank. Be ready to explain why. (Do not just memorize the answers)


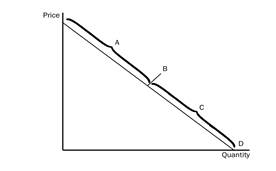
a. The elastic section of the graph is represented by section _______.

b. The inelastic section of the graph is represented by section _______.

c. The unit elastic section of the graph is represented by section _______.

d. The portion of the graph in which a decrease in price would cause total revenue to fall would be _________.

e. The portion of the graph in which a decrease in price would cause total revenue to rise would be _________.

f. The portion of the graph in which a decrease in price would not cause a change in total revenue would be _________.

g. The section of the graph in which total revenue would be at a maximum would be _______.

h. The section of the graph in which elasticity is greater than 1 is _______.

i. The section of the graph in which elasticity is equal to 1 is ______.

j. The section of the graph in which elasticity is less than 1 is _______.


  1. There two formulas to calculate the price elasticity of demand/supply. Show both of them with numbers and prove which one is better and why?


  1. Sketch three demand curves. Curve A should be perfectly elastic, curve B should be perfectly inelastic, and curve C should be unit elastic.


  1. What is the price elasticity of supply? What are the determinants of the price elasticity of supply, and how does each affect elasticity?


  1. Define cross-price elasticity of demand. What does it measure? What does it means if the cross-price elasticity is negative; positive?


  1. Asset, a fisherman, goes out with a boat and a net early each morning. At 7:00 a.m., Asset takes his day's catch to the fish market and sells it at the market price. As a result of new information about the beneficial effects on health of a fish-rich diet, the demand for fish increases. How will Jack's supply of fish respond to the increased demand and higher price for his product in the short run and in the long run?


  1. In the 1970s, OPEC caused a dramatic increase in the price of oil. What prevented it from maintaining this high price through the 1980s? Graph your answer as well.


  1. Be ready to define any economic terms on Key Concepts.


31. Why do farmers suffer declines in their total revenues when they become more productive as a group? You can also demonstrate your answer on the graph. (Hint: Why good news for farming can be bad news for farmers).


Дата добавления: 2015-07-25; просмотров: 236 | Нарушение авторских прав


<== предыдущая страница | следующая страница ==>
Chapter 4| Chapter 6

mybiblioteka.su - 2015-2024 год. (0.007 сек.)