|
Читайте также: |
April 12th, 2005
As requested by Joerg in Germany, I am going to cover the topic of regression analysis over the next few days - including formulas, built-in functions and charting with trendlines.
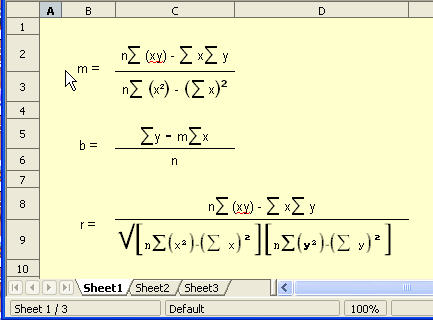
Consider a set of data point pairs - which suggests a possible linear relationship between the two variables.
The equations below are used to calculate the slope m and y-intercept point b for a given set of data, as well as the correlation coefficient r.
Given the formula above, it is a straightforward process to extract the linear coefficients for the given set of data points.
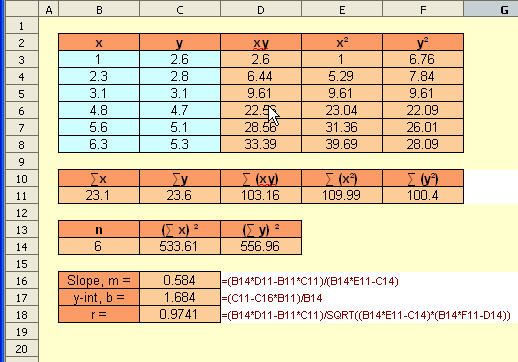
Next, we will look at buil-in OOo Calc functions and the plotting of the trendline for this linear regression example.
Posted in Math & Statistics | No Comments»
Дата добавления: 2015-08-03; просмотров: 48 | Нарушение авторских прав
| <== предыдущая страница | | | следующая страница ==> |
| Conditional summation revisited | | | Regression Analysis II : Basic functions, charting |