Студопедия
Случайная страница | ТОМ-1 | ТОМ-2 | ТОМ-3
АрхитектураБиологияГеографияДругоеИностранные языки
ИнформатикаИсторияКультураЛитератураМатематика
МедицинаМеханикаОбразованиеОхрана трудаПедагогика
ПолитикаПравоПрограммированиеПсихологияРелигия
СоциологияСпортСтроительствоФизикаФилософия
ФинансыХимияЭкологияЭкономикаЭлектроника

Basic Functions: FREQUENCY

Datapilot Revisited | DataPilot Revisited II | Ranking and sorting data I | Conditional summation revisited | Regression analysis I : Basic linear formulas | Regression Analysis II : Basic functions, charting | Regression Analysis III : LINEST | Combining data in cells | Date & Time : Calculating Dates of Holidays | Financial Functions 3 : Complex Accumulation |


Читайте также:
  1. Advanced Functions: INDIRECT
  2. Basic Functions : CELL
  3. Basic Functions : FIXED
  4. Basic functions : SUBTOTAL
  5. Basic functions : SUMIF
  6. Basic structures

March 17th, 2005

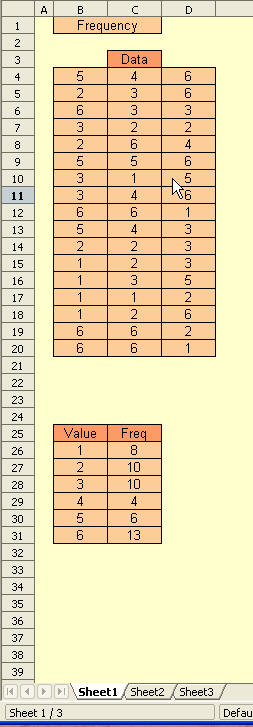
The following tips will show how the FREQUENCY function can be used in conjunction with the charting capabilities of OpenOffice Calc to create frequency plots of data.


In the example below, our data is in B4:D20. We wish to plot the frequency of occurence of the numbers listed in B26:B31.

The corresponding frequency tabe C26:C31 is created with the array function

{=FREQUENCY(INT(B4:D20);B26:B30)}

For some reason (OOo Calc bug?), you need to specify B26:B30 rather than B26:B31 - but it seems to work as entered here.


Дата добавления: 2015-08-03; просмотров: 55 | Нарушение авторских прав


<== предыдущая страница | следующая страница ==>
Data Consolidation 101| Advanced Functions: INDIRECT

mybiblioteka.su - 2015-2024 год. (0.005 сек.)