Читайте также:
|
September 1st, 2005
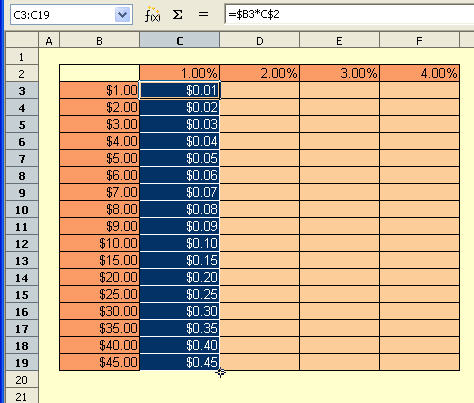
With OOo, it is a straightforward task to generate a “data table” that is basically just multiplying a row by a column. So we have percentages running across the top row and dollar amounts down the first column, everything in between we’d like to be the product of that % and dollar amount.
Step 1: Enter the desired dollar amounts in column B and the percentage values in row 2. Enter the following formula in C3: =$B3*C$2. Pay close attention to the notation in the formula.

Step 2: Position the cursor in the lower right corner of C3 and drag downwards. The formulae are adjusted for each cell with only the row number changing on the dollar value.
Step 3: Now you can drag the column of formulae to the right - and this time, only the columns of the percentage values in each formula change.

Step 4: Confirm the formulae that have been generated by selecting Tools - Options and then the OpenOffice.org Calc - View options dialog. Make sure the Formulas checkbox is active and this is what you will see.

Дата добавления: 2015-08-03; просмотров: 53 | Нарушение авторских прав
| <== предыдущая страница | | | следующая страница ==> |
| Formatting ratios | | | Spelling out numbers |