Читайте также:
|
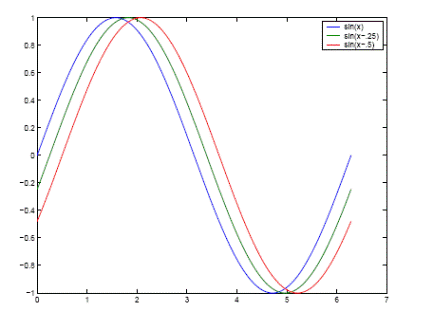
Multiple x-y pair arguments create multiple graphs with a single call to plot. SCILAB automatically cycles through a predefined (but user settable) list of colors to allow discrimination among sets of data. For example, these statements plot three related functions of x, each curve in a separate distinguishing color.
>>y2 = sin(x-.25);
>>y3 = sin(x-.5);
>>plot(x,y,x,y2,x,y3)
The legend command provides an easy way to identify the individual plots.
>>legend('sin(x)','sin(x-.25)','sin(x-.5)')

Figure 5.2 – Multiple Data Sets in One Graph
Plots of the Parameter Functions
For example, these statements plot function y(t)=0.7cos(t) of x(t)=0.5sin(t), where parameter t € [0, 2π]:
>>t=[0:0.01:2*pi];
>>x=0.5*sin(t);
>>y=0.7*cos(t);
>>plot(x,y)
Plot of the sectionally given function
It is given 
These statements plot of the sectionally given function:
>>x1=[-2*pi:0.01:-pi];
>>y1=pi*sin(x1);
>>x2=[-pi:0.01:pi];
>>y2=pi-abs(x2);
>>x3=[pi:0.01:2*pi];
>>y3=pi*sin(x3).^3;
>>x=[x1 x2 x3];
>>y=[y1 y2 y3];
>>plot(x,y)
or
>>plot(x1,y1,x2,y2,x3,y3)
5.3.2 The fplot function
fplot(<nameFunction >, limits) - produces a graph of function in an interval. Where
<nameFunction> - name of a m-file as:
@ MyFun or 'MyFun'
or a line of a kind:
'sin(x)',
'[sin(x) cos(x) ]',
'[sin(x), myfun1(x), myfun2(x)]'.
limits=[xmin xmax ymin ymax] – defines intervals for values of argument and function.
For example:
fplot(@humps,[0 1]);
fplot('humps',[0 1]);
fplot('[tan(x),sin(x),cos(x)]',2*pi*[-1 1 -1 1]);
fplot('sin(1./ x)', [0.01 0.1],1e-3).
Preparing Graphs for Presentation
Specifying Line Styles and Colors
It is possible to specify color, line styles, and markers (such as plus signs or circles) when you plot your data using the plot command.
plot(x,y,'color_style_marker' )
color_style_marker is a string containing from one to four characters (enclosed in single quotation marks) constructed from a color, a line style, and a marker type:
· color strings are 'c', 'm', 'y', 'r', 'g', 'b', 'w', and 'k'. These correspond to cyan, magenta, yellow, red, green, blue, white, and black;
· linestyle strings are '-' for solid, '--' for dashed, ':' for dotted, '-.' For dash-dot. Omit the linestyle for no line;
· the marker types are '+', 'o', '*', and 'x' and the filled marker types are 's' for square, 'd' for diamond, '^' for up triangle, 'v' for down triangle, '>' for right triangle, '<' for left triangle, 'p' for pentagram, 'h' for hexagram, and none for no marker.
You can also edit color, line style, and markers interactively.
Дата добавления: 2015-10-29; просмотров: 145 | Нарушение авторских прав
| <== предыдущая страница | | | следующая страница ==> |
| Examples of Expressions | | | Plotting Lines and Markers |