Читайте также:
|
Although it is difficult to paint a picture of the average American today, there is no difficulty in obtaining data to describe American society.
The information is public and easily available, and anyone interested in accurate descriptive data on the U.S. should consult the most recent edition of the Statistical Abstract of the United States.
Here we have basic information about American society. This type of information, for example, tells us that the territory and the population of the United States is, what is the density of population. Also of basic interest is how the U.S. population can be categorized by race and ethnic origin.
It should be kept in mind that the figures in charts are based upon "self-identification." In other words, Americans themselves determine with which groups they wished to be identified.
Study the figures below and compare the data of 2010 census with the estimates of 2012.
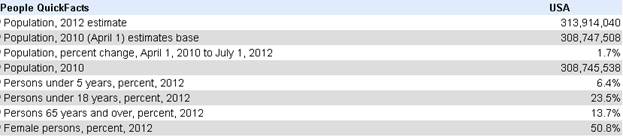

From http://quickfacts.census.gov/qfd/states/00000.html
The U.S. Constitution mandates that a census be taken in the United States every 10 years. This is required in order to determine the number of seats each state is to receive in the U.S. House of Representatives.
Population Distribution and Change: 2000 to 2010
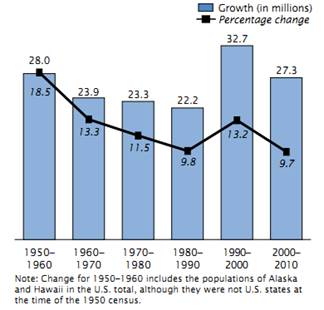
The 2010 Census reported 308.7 million people in the United States, a 9.7 percent increase from the Census 2000 population of 281.4 million. NATIONAL AND REGIONAL CHANGE
The increase of 9.7 percent over the last decade was lower than the 13.2 percent increase for the 1990s and comparable to the growth during the 1980s of 9.8 percent (Figure 1). Since 1900, only the 1930s experienced a lower growth rate (7.3 percent) than this past decade.
From 2000 to 2010, regional growth was much faster for the South and West (14.3 and 13.8 percent, respectively) than for the Midwest (3.9 percent) and Northeast (3.2 percent). The South grew by 14.3 million over the decade to 114.6 million people, while the West increased by 8.7 million to reach 71.9 million people—surpassing the population of the Midwest. The Midwest gained 2.5 million, increasing that region's population to 66.9 million, and the Northeast's gain of 1.7 million brought that region's population to 55.3 million. Overall, the South and West accounted for 84.4 percent of the U.S. population increase from 2000 to 2010, an increase from their 77.0 percent share of the total change from 1990 to 2000.
Figure 1. U.S. Population Change: 1950-1960 to 2000-2010

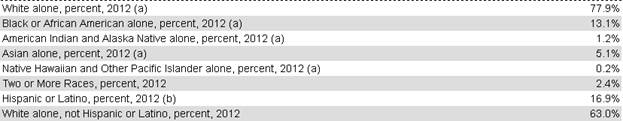
The White Population: 2010
The report about white population provides a portrait of the White population in the United States and discusses its distribution at the national level and at lower levels of geography.
THE WHITE POPULATION: A SNAPSHOT
The 2010 Census showed that the U.S. population on April 1, 201 0, was 308.7 million. Out of the total population, 223.6 million people, or 72 percent, identified as White alone. In addition, 7.5 million people, or 2 percent, reported White in combination with one or more other races.
Together, these two groups totaled 231.0 million people. Thus, 75 percent of all people in the United States identified as White, either alone, or in combination with one or more other races.
The White population Increased at a slower rate than the total population.
MULTIPLE-RACE REPORTING AMONG THE WHITE POPULATION
The proportion of Whites who reported more than one race grew by 3 7 percent.
Two of the race combinations contributed to most of the growth among Whites who reported multiple races.
The largest multiple-race combination was White and Black.
The White population who identified as Hispanic grew by 56 percent.
Three-fourths of the growth in the White population was due to growing numbers of Hispanic Whites.
THE GEOGRAPHIC DISTRIBUTION OF THE WHITE POPULATION
The majority of the White alone-or-in-combination population lived in the South and the Midwest.
According to the 2010 Census, of all respondents who reported White alone-or-in-combination, 36 percent lived in the South, 24 percent lived in the Midwest, 22 percent lived in the West, and 18 percent lived in the Northeast
The places with the largest White populations were New York, NY; Los Angeles, CA; Chicago, IL; Houston, TX; and San Antonio, TX, followed by Phoenix, AZ, San Diego, CA, Philadelphia, PA, Dallas, TX, Austin, TX, Honolulu, HI, San Jose, CA, San Francisco, CA.
More than half of the top ten places with the biggest percentage of Whites were in the West.
Summary
This report provided a portrait of the White population in the United States and contributes to our understanding of the nation's changing racial and ethnic diversity.
While the White population continued to be the largest race group, representing 75 percent of the total population, it grew at a slower rate than the total population. The majority of the growth in the White population was due to the growth among Hispanic Whites. The increase in the multiple-race reporting of groups that included White, specifically the White and Black population and the White and Asian population also contributed to the growth of the White population.
Additional notable trends were presented in this report. The White population has become more diverse as evidenced by the growth of the Hispanic White population and the multiple-race White population.
Geographically, the White alone-or-in-combination population grew in the South and West regions, but was constant or declined in the Northeast and Midwest regions.
The non-Hispanic White alone population grew at an even slower rate. On the other hand, multiple-race Whites grew in every region between 2000 and 2010, particularly in the South and the Midwest.
Throughout the decade, the Census Bureau will release additional information on the White population, including characteristics such as age, sex, and family type, which will provide greater insights to the demographic characteristics of this population at various geographic levels.
Дата добавления: 2015-10-29; просмотров: 170 | Нарушение авторских прав
| <== предыдущая страница | | | следующая страница ==> |
| Why They Came - Why They Come | | | Бақылау сұрақтары |