|
Читайте также: |
Hillard and Cahn[3] proposed a method to estimate the relative standard error in areal analysis:
 (9)
(9)
where n is the number of minor phase areas measured, and  and σA are the mean and the standard deviation of the measured areas. They further show that for a uniform structure of equal size spheres:
 (10)
(10)
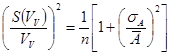
However, for more realistic structures:
 (11)
(11)
Substitution of Eqn. (11) into Eqn. (9) gives:
 (12)
(12)
The relative standard error in this case is therefore independent of the volume fraction second phase in the sample. Eqn. (12) has been used to generate the data in Table 4, which shows the estimated number of areas required for certain 95% confidence limits..
| Relative Error | 95% CL | No. of areas, n |
| 0.010 | ± 2% | |
| 0.025 | ± 5% | |
| 0.050 | ± 10% | |
| 0.100 | ± 20% |
Table 4 – Number of second phase areas needing to be measured in order to achieve various estimated relative errors of volume fraction in the areal analysis method, determined from Eqn. (12).
As can be seen from Table 4, the values of n are of the same order as for point counting, but once again these should really be compared to the number of points in the minor phase, Pminor = VVP, indicating that point counting is statistically more efficient.
Size from Planar Sections
Grain Size
When we measure the size of the grains in a metallic sample, we are almost always looking at a 2D section through the material. It is normal practice to report the grain sizes measured in 2D, without accounting for their 3D nature. The next lecture will consider such conversions in situations where they are applied, but for grain size determination it should just be remembered that the true grain dimensions and distribution of sizes may be larger than that reported.
In some practical situations, grain size is assessed by comparison of an image with a series of standard images of microstructures. This method is rapid, but it is imprecise and not suitable for detailed quantitative analysis (being rather used for quality control in an industrial setting) and is not discussed here.
Дата добавления: 2015-10-26; просмотров: 106 | Нарушение авторских прав
| <== предыдущая страница | | | следующая страница ==> |
| Worked Example – Part 1 | | | Worked Example 1 |