Читайте также:
|
Project management can involve many aspects of developing software, such as tracking remaining work and open bugs, determining how much work you can commit to with your available resources, and even helping to enforce a standard process of interaction between your team members.
1. First, launch Web Accessfrom Team Explorer (Figure 1) or browse to Web Access (as shown in Figure 2).

Figure 1. Launching Web Access via Team Explorer
Figure 2. Launching Web Access Site via a Web Browser
As you can see in Figure 3, the Home view for the Fabrikam Fiber Web team provides a high-level summary of the current iteration (Sprint 3), including team workload versus capacity, burndown of tasks over time and team favorites, which can include a configurable assortment of work item queries, build definitions and version control paths. In addition, there are links to create new work items and bugs, view the backlog and task board, initiate requests for feedback and so on.

Figure 3. Fabrikam Fiber Web Team Home View
Here I’d like to mention a new feature in Team Foundation Server 2012, which is the Members section, highlighted in Figure 3. With the Members section, it is easy to assign work to individuals. In this area, we can see all the team members who are responsible for handling the engineering work associated with Fabrikam Fiber’s Web presence.
The product backlog can be reviewed by selecting the View Backlog link under Activities, which displays the backlog shown in Figure 4. The product backlog contains items or bugs that have not yet been assigned and committed to an iteration. These items represent product background item stories that will eventually be broken down into smaller tasks for the team to take on. The current iteration shown in the tree on the left side of Figure 4 is Sprint 3. Team Foundation Server uses the current date and time to determine the current iteration.

Figure 4. Product Backlog View
Assume that the director of Fabrikam Fiber has requested that a new user story be implemented for the customer-facing service portal. This new user story will enable customers to see weather-related service outages. In the Contents section for the product backlog, select the last row and then create a new product backlog item with the title “Customer should see weather-related outages on portal,” as shown in Figure 5.

Figure 5. Adding a Product Backlog Item Story to the Product Backlog
New work items are inserted above the selected location, with the exception that if you select the last work item, the new item is inserted after the selected location. Work items on the product backlog are ordered based on priority, with high-priority items at the top. Our new work item has a high priority, so move it to the top of the list by dragging it into place.
Now it’s time to assign the new backlog item to the product owner and record an initial estimate of expected effort. First you need to select the user story for edit as shown in Figure 6.

Figure 6. Select a Product Backlog Item to Edit It
Assign the item to Brian Keller, set the state to Approved, and set an initial effort of 8. Then select Save and Close, as shown in Figure 7.
Why 8? Each team can choose to define the Effort value as they see fit, using a unit of story points or the number of sodas required. The point here is that this measure is a relative value with respect to other work items. Work will be broken down into hours later. 
Figure 7. Assigning the New User Story and Estimating Effort
Now assign the new user story to the current iteration, Sprint 3, by dragging it as shown in Figure 8.

Figure 8. Assigning the New User Story to the Current Iteration
Look at the Iteration Path column for the new user story to be sure that it was assigned to Sprint 3 as expected. This user story will remain on the product backlog until the team commits to taking it on.
The product backlog view also provides a velocity chart that shows the amount of work that the team has undertaken in each sprint, with the current sprint breaking that down further to differentiate work in progress and work completed. Click on the velocity minichart in the upper-right corner to load the larger view shown in Figure 9.
During Sprint 1, the team completed 35 story points worth of effort. Sprint 2 was slightly more productive, with 42 story points completed. The current iteration, represented by Sprint 3, shows that the team has completed 18 story points so far, with 23 remaining. These story points are a relative measure of effort that the team originally forecasted.
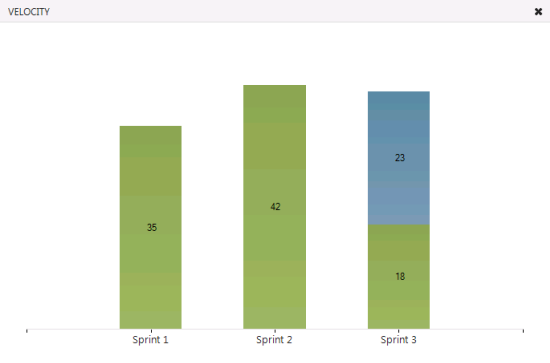
Figure 9. Velocity Chart Showing Progress Toward Completing Product Backlog Items
The product backlog also includes a simple forecasting tool that you can turn on as shown in Figure 10 to get a rough idea of what can be accomplished in future iterations. Select the Forecast link to enable the tool.

Figure 10. Enable the Forecast Tool
Note that forecasting is currently being calculated with a velocity of 10, as shown in Figure 11, meaning that each future iteration will take on about 10 story points worth of effort. As you can see, Sprint 4 is actually forecasted to include 11 story points. Backlog items that do not have effort assigned are assumed to be 0, so it is recommended that this value be set before using the forecast tool.

Figure 11. Result of Forecasting with a Velocity of 10
As we saw from the velocity chart, a velocity of 10 may not be aggressive enough for this all-star team, so click the value 10 and change it to 35. Now that we have the forecasting velocity set to a more realistic value, we can get an idea of what the team can accomplish over the remaining iterations, as shown in Figure 12.

Figure 12. The Forecasted Velocity Using a Value of 35
Now click the Sprint 3 iteration in the list of available iterations. This sprint shows all user stories and associated tasks assigned to the selected iteration, regardless of state, as shown in Figure 13.

Figure 13. Current Iteration Backlog View
At a glance, we can see that the current iteration runs from May 7 to 18, with three working days remaining. Just to the right of the current iteration date range, in the upper-right corner, there is a small graph showing the burndown of the remaining work. Also locate the overall Work bar (just under the graph). This shows how close to capacity we are for the current iteration based on the total of the remaining work for the tasks in this iteration and based on the total capacity for the team. It looks like we are okay for now, but we still have not broken the new user story into tasks for the team yet.
The Capacity view allows us to specify the number of hours per day that each team member will be working on this project, as well as days off per team member and overall team days off. These capacity settings apply to the current iteration. Use the Activity column to describe the disciplines that each team member specializes in. This provides you with another view across your team’s capacity to determine whether, for example, you have enough people working on documentation to meet the demands for this iteration. For now, leave the capacity settings unmodified, as shown in Figure 14.
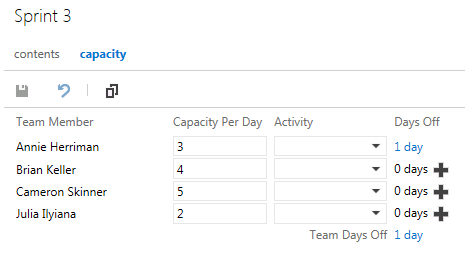
Figure 14. Team Capacity Settings
Before we move on and commit to the new product backlog item story that we just added, let’s take a look at a new feature in Team Foundation Server 2012 Update 1, Kanban support. With this update, Microsoft adds support for Kanban by including a board for the backlog, work-in-progress limits and cumulative flow diagrams.
Kanban is a process-improvement technique that can be used in an incremental fashion regardless of the current software development methodology.
Kanban support adds a new graph to the Product Backlog view called the cumulative flow diagram, which you can see just to the left of the velocity minichart. The Kanban board (Figure 15) shows the top backlog items across all states and iterations, allows you to move items between states and allows you to set work-in-progress (WIP) limits for each state.

Figure 15. Kanban Board
Change the work-in-progress limit for the Committed state to 3. After this is set, we will be at the limit shown in Figure 16.
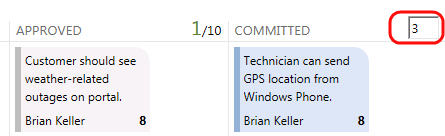
Figure 16. Setting Work-In-Progress Limit
Now assume that we are meeting as a team to commit to the new product backlog item story and break it up into tasks. Drag the new work item to the Committed column. Once the team commits to the work, the item is moved from the product backlog.
Now the decision has been made to proceed with committing to the new work item. Let’s return to the Sprint 3 iteration backlog view and add a new task (see Figure 17) that will become a child task of the user story and will be used to help describe the implementation details required to complete this user story.
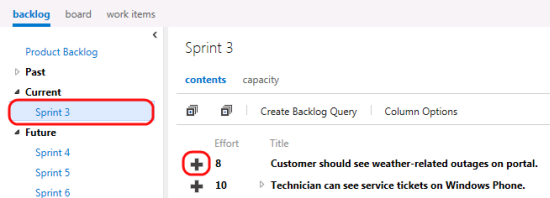
Figure 17. Click the Plus Sign to Create a New Task
Let’s call the new task “Consume OData feed for weather alerts” and assign it to Cameron Skinner. The remaining work is specified as 5 hours, as shown in Figure 18.
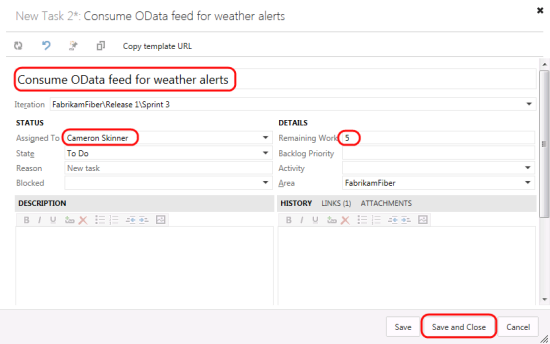
Figure 18. Creating a New Task
Create another task, called “Create UI for alerts,” which will be assigned to Annie Herriman. She estimates the total work for this task to be 3 hours, and this value is entered into the Remaining Work field.
Note that the new tasks are added as children of the product backlog item story and that some of the work effort bar graphs have now turned red (Figure 19). This indicates that we have too much work assigned to the team based on its available capacity.

Figure 19. Product Backlog for Current Iteration Is Now Over Capacity
It looks like the last user story in this sprint is a sizable one, and it has not been started yet, so this could be a good candidate to reschedule for a future iteration so that the team can get back on track given its additional workload. Drag the last user story, titled “Technician can edit customer contact details on Windows Phone,” to the Sprint 4 iteration on the left side of the window. Now look at the overall work bar once again to make sure it is green. This means that we are well within the current team capacity, as shown in Figure 20.

Figure 20. Remaining Work for Current Iteration Is Within Capacity
Working with the Task Board
2. Now that we’ve finished breaking down the work and assigning it to team members, let’s look at the task board that will be used in the next stand-up team meeting to report and record progress. Click the link shown in Figure 21 to view the board.

Figure 21. Click Here to View the Task Board
3. As shown in Figure 22, the task board shows all tasks for the current iteration, grouped by product backlog item and by the current state. Move the “Consume OData feed for weather alerts” task to the In Progress column.

Figure 22. Using the Task Board to Move Tasks Between States
Each row representing a work item shows a rollup of hours remaining, which is a sum of remaining work for all child tasks. In addition to that, each column representing a status has a rollup of remaining work, giving you a good idea how much work the team is actively working on right now, as shown in Figure 23. The burndown chart in the top-right corner updates immediately after we make these changes.
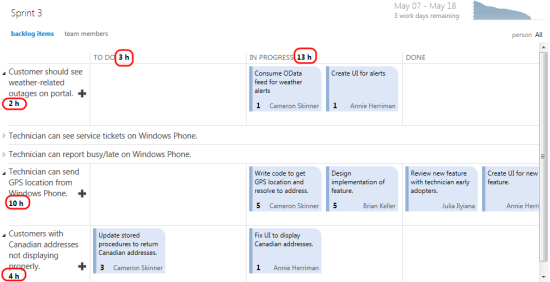
Figure 23. Task Board Showing Rollup of Hours
Дата добавления: 2015-10-24; просмотров: 153 | Нарушение авторских прав
| <== предыдущая страница | | | следующая страница ==> |
| Explain four ways of looking at ALM | | | Name three Cloud Computing Patterns and explain each of them. |