|
Читайте также: |
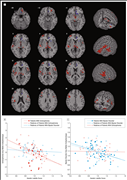
Gray matter endophenotypes associatedwith genetic risks for schizophrenia and bipolar disorder. A, Map of graymatter volume deficits associated with genetic risks for schizophrenia (redvoxels) and bipolar disorder (blue voxels) superimposed onto a single brainin standard stereotactic space. Green indicates overlapping voxels. Clusterwiseprobability of type 1 error, P =.004 forboth schizophrenia and bipolar disorder; that is, <1 false-positive testresult. The z coordinate for each axial slice inthe plane of the Talairach atlas is given in millimeters, and the right sideof each panel represents the right side of the brain. B, Linear associationsbetween systemic gray matter volume deficits in regions associated with geneticrisk for schizophrenia (y-axis) and genetic liability score (x-axis) estimatedseparately for patients with schizophrenia, unaffected relatives of patientswith schizophrenia, and unaffected relatives of patients with bipolar disorder.First principal component scores (y-axis) summarize correlated gray matterdeficits in all frontal, temporal, and subcortical regions for each individual.C, Linear associations between gray matter volume deficits in regions associatedwith genetic risk for bipolar disorder (y-axis) and genetic liability score(x-axis) estimated separately for patients with bipolar disorder, unaffectedrelatives of patients with bipolar disorder, and unaffected relatives of patientswith schizophrenia. Genetic liability scores are adjusted to the sample meanfor age, sex, and subject group.
+ 
View Large | Save Figure | Download Slide (.ppt) | View in Article Context
Table Graphic Jump Location Table 2. Anatomical Location, Approximate Brodmann Areas, and ClusterSize and Loading Scores on First PC for Endophenotypic Regions of Gray andWhite Matter Significantly Associated With Genetic Liability for Schizophreniaand Bipolar Disorder
+ 
View Large | Save Table | Download Slide (.ppt) | View in Article Context
Table Graphic Jump Location Table 3. Genetic-Phenotypic Associations Between Genetic LiabilityScores and Gray or White Matter Endophenotypic Systems*
+ 
View Large | Save Table | Download Slide (.ppt) | View in Article Context
In contrast, genetic risk for bipolar disorder was associated with graymatter deficits in an almost completely separate and relatively circumscribedset of regions, principally the right anterior cingulate gyrus and ventralstriatum (Figure 1A and Table 2). Regional analysis confirmed that genetic risk was associatedwith reduced gray matter volume of the anterior cingulate gyrus and striatumin patients with bipolar disorder and their relatives (Table 3); there was no significant interaction between subject groupand genetic liability score, again indicating that this association was notdetermined solely by abnormalities in the patients (Table 3 and Figure 1C).
Дата добавления: 2015-08-17; просмотров: 78 | Нарушение авторских прав
| <== предыдущая страница | | | следующая страница ==> |
| GRAY MATTER ENDOPHENOTYPES | | | Figure 2. |