Amplitude
The a in the expression y = a sin x represents the amplitude of the graph. It is an indication of how much energy the wave contains.
The amplitude is the distance from the "resting" position (otherwise known as the mean value or average value) of the curve. In the interactive above, the amplitude can be varied from 10 to 100 units.
Amplitude is always a positive quantity. We could write this using absolute valuesigns. For the curves y = a sin x,
amplitude = | a |
Graph of Sine x - with varying amplitudes
We start with y = sin x.
It has amplitude = 1 and period = 2π.
Now let's look at the graph of y = 5 sin x.
This time we have amplitude = 5 and period = 2π. (I have used a different scale on the y -axis.)
And now for y = 10 sin x.
Amplitude = 10 and period = 2π.
For comparison, and using the same y -axis scale, here are the graphs of p (x) = sin x, q (x) = 5 sin x and r (x) = 10 sin x on the one set of axes.
Note that the graphs have the same period (which is 2π) but different amplitude.
Sine Graph Java Applet
Here's another trigonometric graph interactive to play with. In this Java applet, you can vary the amplitude by using the slider at the bottom. You can also change the function to whatever you like. Try changing it to a*cos(x) and see that the amplitude changes as the value of a changes.
You can also see the effect of a negative in front of the a value.
Show java applet
Graph of Cosine x - with varying amplitudes
Now let's see what the graph of y = a cos x looks like.
Similar to the sine interactive at the top of the page, you can change the amplitude using the slider.
Did you notice?
Now let's have a look at the graph of y = cos x.
We note that the amplitude = 1 and period = 2π.
Similar to what we did with y = sin x above, we now see the graphs of
on one set of axes, for comparison:
Note: For the cosine curve, just like the sine curve, the period of each graph is the same (2π), but the amplitude has changed.
Exercises
Need Graph Paper?
Download graph paper
Sketch one cycle of the following without using a table of values! (The important thing is to know the shape of these graphs - not that you can join dots!)
Each one has period 2π. We learn more about period in the next section Graphs of y = a sin bx.
The examples use t as the independent variable. In electronics, the variable is most often t.
1) i = sin t
Answer
1) i = sin t
We saw this curve above, except now we are using i for current and t for time. These are very common variables in trigonometry.
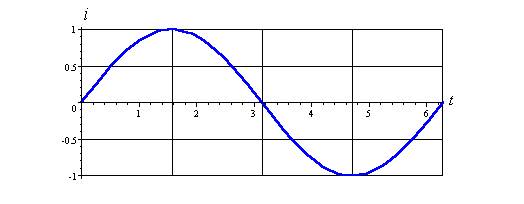
Period = 2π
Amplitude = 1
Get the Daily Math Tweet!
IntMath on Twitter
2) v = cos t
Answer
2) v = cos t
Once again, we saw this curve above, except now we are using v for voltage and t for time.
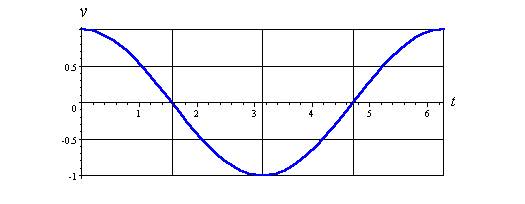
Period = 2π
Amplitude = 1
Top of Form
Bottom of Form
Please support IntMath!
3) i = 3 sin t
Answer
3) i = 3 sin t
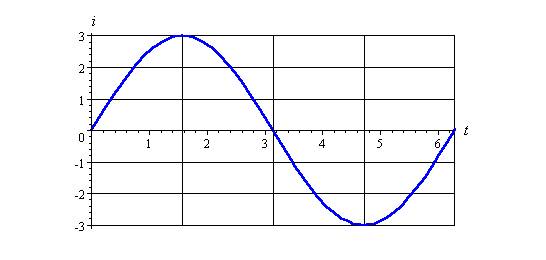
Period = 2π
Amplitude = 3
Top of Form
Bottom of Form
Please support IntMath!
4) E = -4 cos t
Answer
4) E = -4 cos t
The variable E is used for "electro-motive force", another term for voltage.
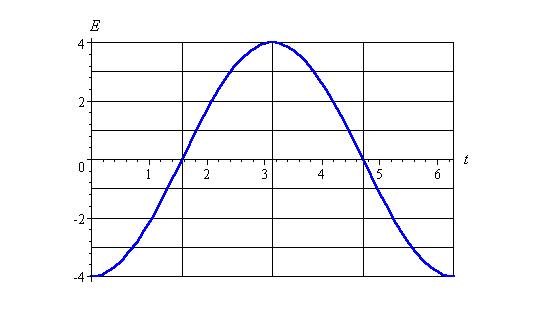
Period = 2π
Amplitude = 4
Notice that:
· The negative in front of the cosine has the effect of turning the cosine curve "upside down". That is, it is a mirror image in the horizontal t axis.
· Amplitude is a positive number (it is a distance)
Дата добавления: 2015-10-29; просмотров: 123 | Нарушение авторских прав
| <== предыдущая страница | | | следующая страница ==> |
| Detached house | | | Answer the questions. |