Читайте также:
|
Q70 World Commission on Environment and Development defines sustainability as:
Forms of progress that meet the needs of the present without compromising the ability of future generations to meet their needs.
Figure 7-12
71. Refer to Figure 7-12. At the equilibrium price, consumer surplus is
| a. | $150. |
| b. | $200. |
| c. | $300. |
| d. | $500. |
72. Refer to Figure 7-12. At the equilibrium price, producer surplus is
| a. | $150. |
| b. | $200. |
| c. | $300. |
| d. | $500. |
73. Refer to Figure 7-12. At the equilibrium price, total surplus is
| d. | $500. |
74. Refer to Figure 7-12. If the government imposes a price floor of $120 in this market, then total surplus will decrease by
| c. | $225. |
75. Refer to Figure 7-12. If the government imposes a price ceiling of $120 in this market, then total surplus will be
| a. | $0. |
| b. | $125. |
| c. | $375. |
| d. | $500. |
76. Refer to Figure 7-12. If the government imposes a price floor of $70 in this market, then total surplus will be
| a. | $0. |
| b. | $125. |
| c. | $375. |
| d. | $500. |
Figure 7-13
77. Refer to Figure 7-13. Total surplus can be measured as the area
| d. | JNL. |
78. Refer to Figure 7-13. For quantities less than M, the value to the marginal buyer is
| a. | greater than the cost to the marginal seller, so increasing the quantity increases total surplus. |
79. Refer to Figure 7-13. For quantities greater than M, the value to the marginal buyer is
| d. | less than the cost to the marginal seller, so decreasing the quantity increases total surplus. |
Figure 7-14

80. Refer to Figure 7-14. Which area represents consumer surplus when the price is P1?
| b. | B |
81. Refer to Figure 7-14. When the price is P1, area B represents
| c. | consumer surplus. |
82. Refer to Figure 7-14. Which area represents producer surplus when the price is P1?
| c. | C |
83. Refer to Figure 7-14. When the price is P1, area C represents
| b. | producer surplus. |
84. Refer to Figure 7-14. When the price is P1, area A represents
| d. | None of the above is correct. |
85. Refer to Figure 7-14. When the price is P1, area B+C represents
| a. | total surplus. |
86. Refer to Figure 7-14. Which area represents total surplus in the market when the price is P1?
| b. | B+C |
Figure 7-15
87. Refer to Figure 7-15. At the equilibrium price, consumer surplus is
| a. | $480. |
88. Refer to Figure 7-15. If the price decreases from $22 to $16 due to a shift in the supply curve, consumer surplus increases by
| b. | $360. |
89. Refer to Figure 7-15. At the equilibrium price, producer surplus is
| b. | $640. |
90. Refer to Figure 7-15. At the equilibrium price, total surplus is
| c. | $1,120. |
91. Refer to Figure 7-15. Assume demand increases and as a result, equilibrium price increases to $22 and equilibrium quantity increases to 110. The increase in producer surplus due to new producers entering the market would be
| a. | $90. |
| b. | $210. |
| c. | $360. |
| d. | $480. |
92. Refer to Figure 7-15. Assume demand increases and as a result, equilibrium price increases to $22 and equilibrium quantity increases to 110. The increase in producer surplus to producers already in the market would be
| a. | $90. |
| b. | $210. |
| c. | $360. |
| d. | $480. |
93. Refer to Figure 7-15. Assume demand increases and as a result, equilibrium price increases to $22 and equilibrium quantity increases to 110. The increase in producer surplus would be
| d. | $570. |
94. Refer to Figure 7-15. The efficient price is
| c. | $16, and the efficient quantity is 80. |
95. Refer to Figure 7-15. If 110 units of the good are being bought and sold, then
| c. | the marginal cost to sellers is greater than the marginal value to buyers. |
96. Refer to Figure 7-15. If 40 units of the good are being bought and sold, then
| a. | the marginal cost to sellers is equal to the marginal value to buyers. |
| b. | the marginal value to buyers is greater than the marginal cost to sellers. |
| c. | the marginal cost to sellers is greater than the marginal value to buyers. |
| d. | producer surplus would be greater than consumer surplus. |
Figure 7-16
97. Refer to Figure 7-16. The equilibrium price is
| b. | P2. |
98. Refer to Figure 7-16. At equilibrium, consumer surplus is represented by the area
| b. | A+B+C. |
99. Refer to Figure 7-16. If the price were P3, consumer surplus would be represented by the area
| a. | A. |
100. Refer to Figure 7-16. At equilibrium, producer surplus is represented by the area
| c. | D+H+F. |
101. Refer to Figure 7-16. If the price were P1, producer surplus would be represented by the area
| a. | F. |
102. Refer to Figure 7-16. At equilibrium, total surplus is represented by the area
| c. | A+B+C+D+H+F. |
103. Refer to Figure 7-16. The efficient price-quantity combination is
| b. | P2 and Q2. |
Figure 7-17
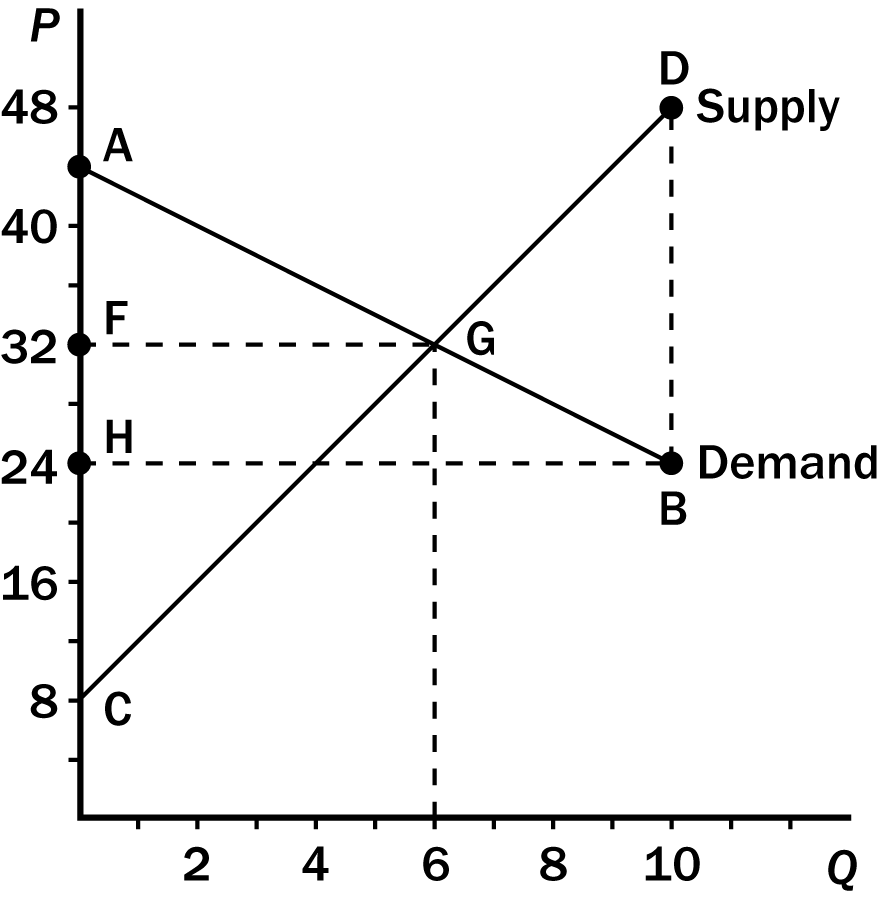
104. Refer to Figure 7-17. At equilibrium, consumer surplus is measured by the area
| b. | AFG. |
105. Refer to Figure 7-17. At equilibrium, consumer surplus is
| a. | $36. |
| b. | $72. |
| c. | $108. |
| d. | $144. |
106. Refer to Figure 7-17. At equilibrium, producer surplus is measured by the area
| d. | CFG. |
107. Refer to Figure 7-17. At equilibrium, producer surplus is
| a. | $36. |
| b. | $72. |
| c. | $108. |
| d. | $144. |
108. Refer to Figure 7-17. At equilibrium, total surplus is measured by the area
| a. | ACG. |
109. Refer to Figure 7-17. At equilibrium, total surplus is
| a. | $36. |
| b. | $72. |
| c. | $108. |
| d. | $144. |
110. Refer to Figure 7-17. The equilibrium allocation of resources is
| a. | efficient because total surplus is maximized at the equilibrium. |
| b. | efficient because consumer surplus is maximized at the equilibrium. |
| c. | inefficient because consumer surplus is larger than producer surplus at the equilibrium. |
| d. | inefficient because total surplus is maximized when 10 units of output are produced and sold. |
111. Refer to Figure 7-17. If 4 units of the good are produced and sold, then
| a. | the cost to sellers exceeds the value to buyers. |
| b. | producer surplus is maximized. |
| c. | total surplus is minimized. |
| d. | the allocation of resources is inefficient. |
112. Refer to Figure 7-17. If 10 units of the good are produced and sold, then
| a. | the marginal cost to sellers exceeds the marginal value to buyers. |
| b. | producer surplus is maximized. |
| c. | total surplus is minimized. |
| d. | the marginal value to buyers exceeds the marginal cost to sellers. |
Table 13-5
Дата добавления: 2015-10-23; просмотров: 743 | Нарушение авторских прав
| <== предыдущая страница | | | следующая страница ==> |
| Supply and Demand, the Market mechanism | | | The Flying Elvis Copter Rides |