Читайте также:
|
Airborne weather radar systems are used for detecting and locating weather targets that exhibit some form of precipitation (moisture). Areas and/or clouds with high moisture content or rainfall rates are usually associated with turbulence, flying hazards etc and should be avoided if at all possible.
It was first thought that all areas of precipitation caused turbulence, but this it not necessarily the case. The latest generation of weather radar systems are capable of detecting turbulence directly in areas of rainfall, in addition to determining the rainfall rate, so giving the flight crew more information with which to make their decisions.
Weather radar can also be used to provide a ground map of the terrain directly in front of the aircraft. Like the radar map provided by the reflected images of precipitation targets, a radar map of the terrain can be a useful tool to a flight crew skilled in its interpretation. In effect, the terrain-mapping capabilities of the airborne weather radar can extend the flight crew's vision. However, it really only gives a broad- brush picture, eg the outline of coastlines, and cannot be used for detailed navigation.
Aircraft Equipment
Most aircraft only have a single weather radar system. Only the largest passenger aircraft, eg Boeing 747, can warrant the cost of a dual system and even then it only uses a single antenna and only one system can be in use at a time. However, most modern systems will allow the use of two separate controllers which timeshare the other system components. More on this later.
Weather radar systems come in all shapes and sizes; some have combined controller/indicators, some have several LRUs for processing data, but most systems usually consists of the following components:
* Transmitter/Receiver
* Weather radar presentation
* Control panel
* Antenna
In addition, the weather radar system needs to interface with other aircraft systems and these are discussed in more detail below.
Depending on the size of the aircraft some of the above components may be combined into integrated units to save space or simplify installation. Figure 2 shows an example of a typical installation.
Weather radar systems in current commercial use operate on one of two frequency ranges. The 4000 - 8000 MHz C-band range or the 8000 - 12,500 MHz X-band range.
The Transmitter/Receiver
Typically, the transmitter/receiver (Tx/Rx) has three basic sections:
* Transmitter
* Receiver
* Data processor
Each section has self-monitoring circuits to check for signal validity, circuit integrity and performance parameters.
The transmitter section produces a multi-pulse, RF signal at X-band or C-band frequencies, at sufficient power to illuminate targets at ranges up to approximately 300 NMs. This signal is fed to the antenna through a duplexer that also couples the receiver section of the Tx/Rx to the antenna feed via a waveguide. The duplexer must have a fast operation to protect the receiver circuits during pulse transmission.
The receiver section contains the signal detection and amplification circuits necessary to process the returned echo RF signal into a useable signal that can be processed by the data processing circuits of the Tx/Rx. As discussed in book 1, most radar receivers incorporate a balanced mixer stage to prevent electrical noise generated internally in the Tx/Rx from reaching the received signal.
The data processing circuits use the received RF return signal to produce a data signal encoding the range, bearing and target information for display on the system indicator. In other words, these circuits decode the analogue RF return signal, ie the signal reflected from a target and then digitally encode the information into a format, usually video, that will be decoded by the indicator.
The data processing circuits also include the electronics that control Tx/Rx and system operation, such as antenna stabilisation, system parameter configuration, and system fault analysis. In this respect the Tx/Rx is the heart and brains of the weather radar system.
Weather Radar Indicators
A typical weather radar indicator is a monochrome or colour CRT display presenting a 2-dimensional map of areas of precipitation, ie weather targets or reflective ground targets.
The amount of energy reflected back to the aircraft will be dependent on the intensity of the target. With modern colour indicators, the reflected energy intensity is converted into a maximum of five colours, depending on the system, to indicate returned signal intensity:
BLACK No detectable weather (target).
GREEN Moderate level of moisture; light levels of turbulence possible.
YELLOW Medium levels of moisture; light-moderate levels of turbulence are
possible with the possibility of lightening.
RED High moisture level; severe levels of turbulence possible with lightening.
MAGENTA Used to indicate the highest level of moisture; severe levels of
turbulence are very likely with lightening and high gusting wind speeds with hail a
possibility. (Magenta is a Light pink colour).
In Map Code the colours are altered to emphasise that the radar is not looking at the weather. These are:
CYAN Minimum detectable ground return. (Cyan is a light blue colour).
YELLOW - Medium ground return.
MAGENTA - High levels of ground return.
The indicator contains the circuits required to decode the information from the Tx/Rx and convert it into video drive signals that will produce the radar map on the CRT. It also contains circuits to monitor its performance and to provide an annunciation of an indicator failure, as well as to annunciate a failure of any other LRU in the system. Figure 3 shows a typical example.
 Fig. 4 TYPICAL WEATHER RADAR CRTS
|
Controls for adjusting the display presentation can be part of the CRT, as shown in figure 4, or the aircraft may be fitted with a separate controller. These controls adjust display brightness, the display of reference markers such as azimuth or range marks, and may also provide power switching for the CRT, or even the whole system.
In modern aircraft, the weather radar display may also be integrated into other aircraft displays, such as those of an Electronic Flight Instrument System (EFIS). These are more sophisticated than conventional displays and can combine with other navigation systems to give a better picture of the aircraft's horizontal situation. As this type of display contains a lot more information besides weather radar returns, it is called a Navigation Display (ND).
Control Panel(s)
As already mentioned, the system control panel may be incorporated into the indicator or be a standalone unit. In either case the controller has all the controls and switches that let the flight crew configure the system operation. In addition, it will also have the circuits required to relay this information to the Tx/Rx. Some modern aircraft fitted with EFIS, have dual independent controllers that may have different selections to each other. In this case, the Tx/Rx timeshares its operation between both control settings and provides different display formats for each pilot's ND. Figure 5 shows some examples of independent controllers.
 Fig. 5 EXAMPLES OF TYPICAL WEATHER RADAR CONTROLLERS
|
Figure 4 shows an example of a combined indicator/ controller, manufactured by Sperry ~~ now part of the Honeywell Corporation, while figure 7 shows a typical standalone controller, also manufactured by Honeywell for the business jet aviation market.
MODE Switches
The five MODE switches at the top of the indicator control the weather radar system. Their functions and those of the other switches and controls are described below:
OFF - The system is not energised.
STBY - The system is energised to warm-up the magnetron and other circuits, but there is no transmitter output.
WX - Normal weather radar operation.
CYC - Normal weather radar operation but with a flashing contour function, ie it flashes on and off for the highest return.
MAP - The system operates in a ground-mapping mode but usually only on the 10 NM and 25 NM ranges.
RANGE Control
The range switch selects the maximum selectable range of the weather radar displays and has full-scale selections of 10, 25, 50, 100, 200 and 300 Nautical Miles (NMs). In addition there is a final TEST' position, which when selected produces a test pattern on the display. With the majority of weather radar systems, when they are put into their system test, they do not provide a transmitted output but the scanner moves.
When in system test there is provided a transmitted output into a dummy load. Even though the scanner is moving there are no RF pulses present at the scanner. This is especially useful for checking the system on the ground.
GAIN Control
This switch controls the gain of the weather radar receiver and reduces it in each position by 6 dB. If this switch is moved out of its 'PRE-SET' position, the mode annunciations on the display alternate with the word 'GAIN'.
STAB Control
This switches the antenna stabilisation in the pitch and roll axis on and off. INT Control
This rotary control sets the level of the screen's intensity.
TILT Control
This rotary knob controls the tilt angle of the scanner between ±15°.
In addition to the above rotary controls and switches, there is an additional four push-on/push-off buttons spaced around the CRT. These illuminate when selected and have the following functions:
FRZ (F) Button
When pressed the weather display is frozen and a flashing 'HOLD' annunciation alternates with the weather radar mode indications. The first button press enables the function and the second press disables it. The weather radar system continues to update when this function is in operation so that the latest information is available when it is de-selected.
TGT ALERT (T) Button
This push-button enables the system's TARGET ALERT'function and when selected displays a yellow T' symbol on the display. The T' will start flashing to alert the flight crew if the weather radar system detects a return with the signal strength of a storm cell, ie a red level indication, in a sector typically within 20 - 150 NMs range and ± 15° of the aircraft's heading, regardless of the selected range. The first button press enables the function and the second press disables it.
AZM (A) Button
When selected, this adds azimuth strobe lines every 30° to the weather display to help the flight crew interpret the data. The first button press enables the function and the second press disables it.
SEC (S) Scan
When selected this reduces the scan width by 50%, typically from 120° to 60°, doubling the normal scan rate. This function is useful on short ranges where the weather picture is changing quickly. The first button press enables the function and the second press disables it.
This type of combined indicator and controller saves instrument panel space, but does have its drawbacks. It is not easily up-gradable and cannot be fitted in modern aircraft with EFIS. Figure 7 shows a typical standalone controller that can be used with an EFIS or a standalone weather radar system.
 Fig. 7 TYPICAL STANDALONE WEATHER RADAR CONTROLLER
|
GAIN Control
This rotary control varies the receiver gain when pulled out of its detent position. As with the combined indicator, each position change usually reduces the receiver gain by 6 dB.
MODE Control
This rotary control allows selection of seven primary operating modes as follows:
OFF - System is electrically isolated.
STBY - The system is energised but there is no transmitter
output.
WX - Normal weather radar operation.
CYC - Normal weather radar operation but with a flashing
contour function for the highest return.
GMAP - Ground mapping mode where the system identifies the
terrain in front of the aircraft but only on the 5, 10, 25 and 100 NM ranges.
FP - This mode is used on modern aircraft fitted with a
compatible Flight Management System (FMS), to superimpose an active flight-plan of waypoints over the weather display.
TEST - When selected this produces a test pattern on the
display, as above.
In addition there are six momentary action push-buttons with alternate action, ie first press 'ON', second press 'OFF' that have the following functions:
TRB - Used for selection of a turbulence sub-mode when
fitted with an appropriate radar system, but only in WX ranges 5, 25 and 50 NMs.
GCR - Used with more modern systems as a selection of
Ground Clutter Reduction sub-mode in WX ranges 10, 25 and 50 NMs only.
TGT - This push-button enables the system's TARGET
ALERT' function and when selected displays a yellow T' symbol on the display. The T' will start flashing to alert the flight crew if the weather radar system detects a return with the signal strength of a storm cell, ie a red level indication, in a sector typically within 50 - 150 NMs range and ±15° of the aircraft's nose, regardless of the selected range. The first button press enables the function and the second press disables it.
SECT When selected this reduces the scan width by 50% typically from 120° to 60°, doubling the normal rate.
TILT Control
This is a rotary control which varies antenna tilt angle between ± 15°. The 'PULL AUTO' function enables the systems auto-tilt circuitry, which adjusts antenna tilt in relation to aircraft altitude.
Range Control (control buttons with up and down arrows)
These two push-button switches provide the system range selection from 5 ~ 300 NMs. The up arrow push-button selects increasing range while the down arrow selects decreasing range. The available range selections are 5, 10, 25, 100, 200 and 300 NMs in WX RCT or GMAP, with additional ranges of 500 and 1000 NMs if selected to 'FP' mode.
ANTENNA
The weather radar antenna is made up of three separate parts:
1. Antenna dish or plate.
2. Antenna scanning mount.
3. Aircraft radome.
 Fig. 8 WEATHER RADAR PARABOLIC ANTENNA - PRINCIPLE
|
Radar systems built before the late 1970s had parabolic (curved) antennas. With these antennas the RF energy was transmitted via a waveguide to the centre horn of the parabolic dish. It was then transmitted towards the dish so that the RF energy was focused into a narrow beam as required for weather radar transmissions (figure 8).
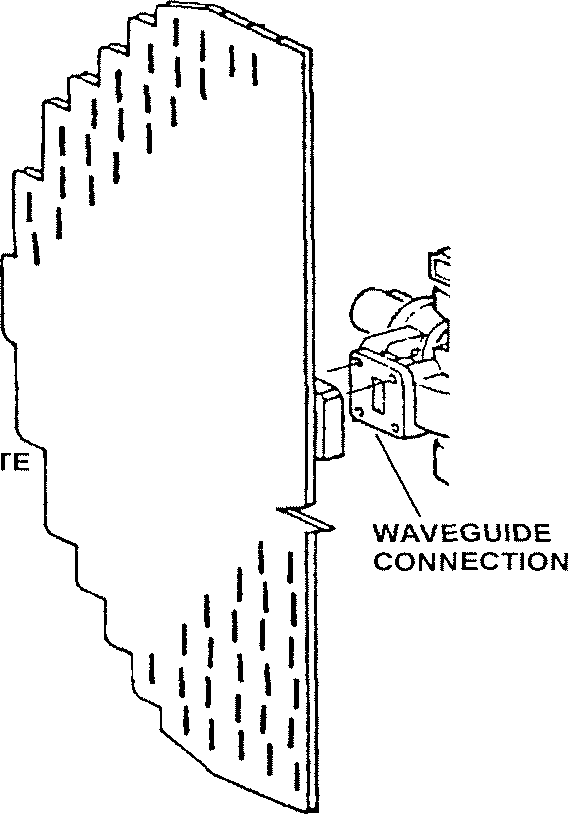
As technology has improved so has our understanding of RF propagation and the most common weather radar antenna in use today is the flat-plate, slotted, phased array. Its basic structure consists of front and rear plates, separated by a space equivalent to the operating frequency's waveguide 'E-plane' dimensions by septum walls running in a vertical direction.
These septum walls are spaced equivalent to the operating frequency's waveguide 'H-plane' dimension and form waveguide channels for a vertical array of slots in the front plate (figure 9).
|
| FLAT PLA* ARRAY |
| Fig. 9 FLAT PLATE ARRAY |
The radar beam from a parabolic type antenna does not have the same pattern as the radar beam from a flat-plate array. The parabolic antenna produces larger side lobes, which subtract from the energy transmitted in the main lobe. Figure 10 shows a pictorial example of this difference in the radiation pattern.
In terms of system operation it means that the flat-plate array produces less false targets due to the side lobes and is capable of detecting more targets directly ahead of the aircraft with greater accuracy in target identification.
Parabolic dishes and flat-plate arrays come in various sizes depending on the aircraft type. The outer profile of the dish or array is approximately circular and their size (diameter) determines the beam width of the transmitted signal. In general, the larger the diameter of the dish/array the narrower the beam width and the greater the angular resolution of the system.
Antenna Mount
Parabolic and flat-plate array antennas are mounted on a pedestal that provides the scanner and tilt drive circuits. These control the antenna's movements and extend it away from the aircraft's bulkhead. This lets the antenna move within the confined space of the aircraft radome, under the control of the scan and tilt drive signals without mechanical interference. Figure 11 shows a typical example.
The antenna drive signals originate from the Tx/Rx compensated for the selected tilt angle and stabilisation. The Tx/Rx uses aircraft pitch and roll information from the aircraft's Vertical Gyroscope (VG) or Initial Reference System (IRS) to produce the necessary scanning and tilt drive signals to ensure the radiated beam sweeps the same area of space ahead of the aircraft, regardless of any normal changes in aircraft attitude.
A typical system scans a 120° sweep in front of the aircraft, ie ± 60° of the aircraft's nose centreline, although some systems can scan for 180°, ie ± 90°.
Radome
The radome is a streamlined weather proof radar transparent covering for the antenna and scanner assembly and forms part of the aircraft structure. The radome must be constructed of materials (fibre glass etc) that offer little resistance (attenuation) to the pulses of energy being transmitted/received. Imperfections in the radome surface must be avoided as these will affect the display on the CRTs.
TYPICAL FLIGHT OPERATION
Weather radar system operations vary with the different types in service and the features offered by the various manufacturers. The following demonstrates the operation of a typical system.
1. The flight crew apply system power and initiate the system's TEST' mode to verify its integrity before flight commencement. Most test operations present a colour or multilevel monochrome pattern on the CRT that shows the flight crew that the vital system components are functioning correctly. This BITE attempts to verify all circuit functions, except transmitter output, but it cannot verify operation of the mechanical portions of the systems, such as controls, switches or mechanical connections.
2. After take-off the flight crew select a weather detection mode as required. During the various phases of flight, eg climb; the flight crew adjust the tilt control to ensure the system scans the area of the sky directly in front of the aircraft.
3. The Tx/Rx generates a pulsed RF signal that is transmitted through the antenna. Between pulses the receiver listens to detect any return signals.
4. The transmitted pulse radiates the area ahead of the antenna and sends the processed returns to the indicator. This information represents the returns received by the Tx/Rx in one azimuth direction. The indicator converts this information from a rho-theta format into an x~y format for presentation on the CRT.
5. Any reflected energy returns from weather precipitation are processed by the Tx/Rx and it determines the range of the target and its strength. This information is decoded and then set to the indicator for display in the correct relative position and with the correct colour level or grey shading (for monochrome indicators).
6. This process continues as the antenna sweeps the sky ahead of the aircraft. After one or two antenna sweeps a complete weather map is obtained.
7. The flight crew's interpretation of the weather map allows them to select a path around or through the weather targets.
WEATHER RADAR OPERATION
Before we can look at how a weather radar system works we really need to understand what it is trying to measure and display.
As already mentioned, the aircraft's weather radar system is used to provide a 2-dimensional map of precipitation areas ahead of the aircraft. However, as the map is only 2-dimensional the weather radar system can only show a representation of a horizontal slice through the storm (figure 12). However, weather radar can only detect precipitation areas and cannot detect Clear Air Turbulence (CAT) such as microbursts and wind shears.
Severe weather that is hazardous to aircraft is always associated with precipitation; the more intense a storm cell is the greater the rate of rainfall. Luckily, a greater rate of rainfall means a better reflective target for weather radar systems to detect.
Weather radar detection of the severity of a storm cell begins with the illumination of the target by its transmitted pulses. Figure 13 shows what happens to the transmitted pulse's energy as it strikes a raindrop.
When the transmitted pulses hit a raindrop, three things occur.
1. Depending on the angle of incidence, some of the energy will be refracted straight through.
2. The raindrop will absorb a small amount of the energy.
3. The remainder will be reflected back - to be picked up by the antenna.
The system in figure 15 shows a frequency multiplication system, which generates a signal, which is then amplified, and its frequency is multiplied to develop the appropriate C-band or X-band frequency. This signal is then modulated into a series of pulses.
Most modern weather radar systems have a selectable transmission pulse width which is based on the selected range operation mode. In this way, ie by using multiple pulse widths, the Tx/Rx can optimise the system's performance for each selected range and operational mode. This gives better resolution of the weather target and makes sure the transmitter is used efficiently.
In addition the majority of transmitters can also vary their Pulse Repetition Frequency (PRF), ie the number of times the pulse is transmitted during one second. In this way, when the system is selected to the shorter ranges, the receiver portion of the Tx/Rx is not listening' for an unnecessarily long period of time. This frees time for the transmitter section to increase the number of transmitted pulses per second (its PRF) and this results in a faster update of any weather targets that are present.
Once the PRF and pulse width are set, the transmit signal is applied through a duplexer to the antenna, which radiates it away from the aircraft in a directional beam as the scanner moves.
Any energy reflected back to the antenna, by weather targets or ground returns, during the listening time between pulses, is applied to the receiver section of the Tx/Rx through the duplexer. These returns are amplified and mixed with a reference frequency to produce an Intermediate Frequency (IF) signal, which makes the design and construction of the processing circuits simpler. If the signals were left at their X-band or C-band values, the circuits would be very complicated in design because of the need to shield circuits to prevent cross-modulation. In addition, the cost of components that can be operated at X or C-band levels are high, as most electronic components are designed to operate at lower frequencies.
The IF is then amplified before being decoded and applied to range and azimuth computation circuit filters. The range filter processes any returned signals with respect to range using the 'radar mile' formula:
Range (R) = Total time (T)NMs 12.36µS
while the azimuth circuits compute the returns position with respect to the scanner position at time of transmission.
In the latest digital systems, the range filter also digitises the analogue return signals and integrates them into range 'bins'. It does this for each azimuth bearing and divides it into data bins for easier data handling. Each data bin then represents the reflectivity (Z) level of the returns at its respective range.
To understand the relationship between turbulence and heavy rainfall we need to examine the mechanics of a thunderstorm (figure 12). Note the turbulence within the cloud itself with air currents moving relatively fast both up and down. Note also the cloud anvil - a part of the cloud that stretches for some considerable distance at altitude to one side of the main cloud body. Note the precipitation beneath the cloud and the areas around the cloud where windshear is likely.
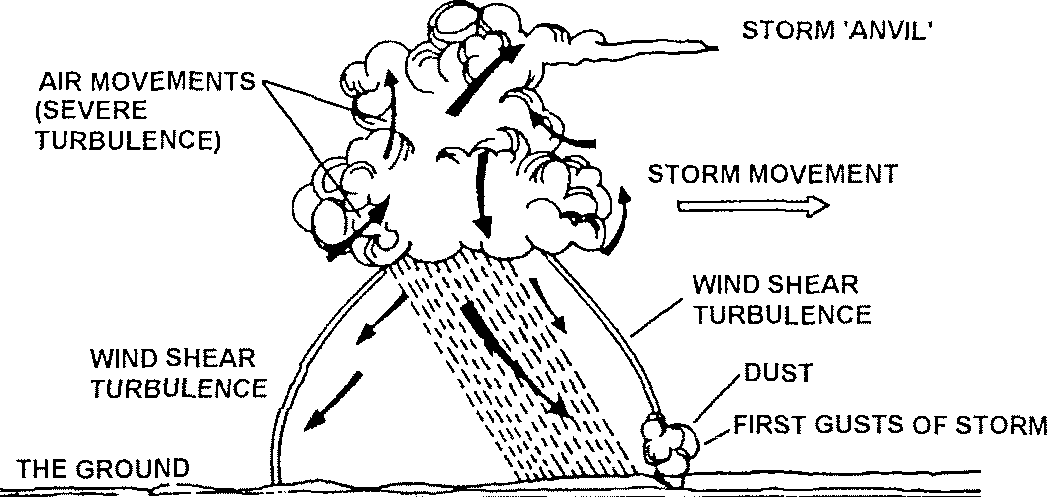 Fig. 14 TYPICAL STORM CLOUD
|
Having looked at the storm construction, we now need to look at the weather radar system itself and how it works. Figure 15 shows a block diagram of a typical modern system.
The transmitted pulse is generated within the Transmitter/Receiver (Tx/Rx). In older systems this is achieved by using a Magnetron. Most modern systems now use a frequency multiplication design to obtain the transmitted frequency. One example would be to use a crystal oscillator which generates an L-band frequency which is multiplied up to an X-band or C-band frequency through a multiplexer. Another would be to use fIMPATT? Diodes or Silicon Controlled Rectifiers (SCRs) and generate the transmitted frequency immediately.
Note. IMPATT diodes were covered in book 1.
The power outputs from modern systems compared to those manufactured only 10 years ago is enormous. Early systems used a magnetron to develop the transmitter frequency and this generate a lot of electrical noise. To ensure a return signal of sufficient strength to overcome this noise, the transmitter had to output many kW of energy. Modern semiconductor devices, like those described above, do not generate anywhere near the amount of noise as a magnetron and so transmitter output levels have been reduced down to about
100W.

Fig. 13 RESULT OF RADAR PULSES STRIKING A RAINDROP
The ability of the rainfall, or other form of precipitation, to reflect the transmitted energy is measured by the reflectivity level, represented by the letter 'Z'. This 'Z' factor is used to relate rainfall levels to the value of the returned signal strength.
Although the 'Z' factor is not an exact measurement of rainfall because it is dependent on a number of factors, eg the type of storm and duration, it is sufficient to indicate the severity of the weather. In addition the reflectivity factor for some forms of precipitation is difficult to determine. For example, hail occurs in many forms such as dry particles, water-coated particles and melted particles, and so are irregular in shape and do not provide a consistent return. Water reflects about five times more radar energy than solid ice particles of the same mass. Detecting snowfall is also difficult unless the moisture content of the snow is sufficient to provide a reflection of the transmitted pulse.
In order to provide the best possible weather information to the flight crew, the 'Z' factors for the various precipitation forms have been optimised and standardised to provide display consistency between all manufacturers of weather radar systems. Table 1 lists the rainfall rates and associated reflectivity levels commonly used in aircraft weather radar systems.
| 'Z' Level | Reflectivity | Rainfall Rate | |
| inches/hour | mm/hour | ||
| Zi | 10 dB | 0.006-0.03 | 0.152-0.762 |
| z2 | 20 dB | 0.03-0.15 | 0.762 - 3.81 |
| Z3 | 30 dB | 0.15-0.5 | 3.81 - 12.7 |
| Z4 | 40 dB | 0.5-2.0 | 12.7 - 50.8 |
| z5 | 50 dB | 2.0-8.0 | 50.8-203.2 |
| TABLE 1 RAINFALL RATES |
In analogue systems the range and azimuth information is sent to the receiver encoder/decoder as a video signal. This is processed with the information from the controller and forwarded onto the display, also as a video signal.
In modern systems the now digitised returns are encoded with the controller information into a serial data word that is transmitted to the indicator.
In either case the indicator decodes the video or serial data word and stores the information in memory until it is used to generate the next raster scan. In most weather radar systems the indicator also displays the system operational mode, range markings and selection and control annunciations in addition to the 2-dimensional weather display (figure 16).
As already discussed above, system range, mode and control selection come from the system controller which maybe part of the indicator (figure 16), or a separate LRU mounted on the instrument or flight deck side panels.
GROUND MAPPING
Aircraft weather radar systems were designed to detect weather targets. However, due to the nature of the energy transmission pattern, they are capable of providing a map of the ground or terrain in front of the aircraft on the lower ranges. Some modern weather radar systems have switchable antenna beams and data processing modes to enhance their ground-mapping capabilities, although it must be emphasised that its primary purpose is the detection of weather.
Ground returns have different reflectivity qualities, just as the various forms of precipitation do and it is this difference that allows the system to produce ground mapping.
The interpretation of ground returns is largely a matter of experience and an understanding of the factors involved when the radar beam strikes a ground target. Although target interpretation is largely the domain of the flight crew, it is still important for the Licensed Engineer to have a grasp of what is going on.
The extent to which ground targets can be displayed depends upon several factors, eg the selected range, antenna tilt, aircraft altitude and attitude. The strength of the signal returns depends on the angle at which the radar beam strikes the ground, ie incidence angle, and the reflectivity properties of the terrain under the aircraft at that time. The characteristics of various types of terrain are described below.
Water
Bodies of water, such as lakes, rivers and oceans, do not usually provide good strong returns and will normally show up as dark areas on the weather radar display. This is because the radar beam is reflected away from the antenna and little, or none, of the signal is returned. However, if the water is rough or choppy, the angle of incidence changes and a stronger return usually enhances the mapping display.
Cities and Built-up Areas
Large buildings, cities and other built-up areas usually give a good return signal, but the resolution and intensity depends on several factors including the selected range, gain settings, aircraft attitude, aircraft altitude and antenna tilt angle.
Individual towns, cities, islands or landmarks can usually be identified by experienced users flying in familiar territory. However, when flying in unknown areas it is usually only used for indicating major changes, eg a coastline or well-known and well-defined landmark, eg the Thames Estuary (London, UK) etc.
PERFORMANCE FACTORS
Several factors affect the performance of weather radar systems. Some of these factors affect the system resolution, ie its ability to detect individual storm cells, while others affect its range and detection capabilities, ie its capacity to detect all types of precipitation; rain, snow, hail etc.
System Resolution
The system's resolution capabilities can be split into two; range resolution and azimuth resolution.
Range Resolution. A weather radar system's range resolution is its ability to separate individual targets, ie storm cells with respect to range (figure 17).
As shown in figure 17, if the range resolution is not correct then two or more storm cells can be shown as one on the display. The factor that limits the weather radar's ability to resolve targets over range is the pulse width of the transmitted signal.
A weather radar's resolution is equivalent to half the pulse width, ie the pulse width measured in microseconds divided by the velocity of light. For example, the Collins WXR-700 weather radar system produces a pulse width of approximately 4.4 microseconds (µS) for a selected operating range of 20 NM. Using the fact that radio waves travel at the speed of light, this 4.4 ^S pulse equates to a burst of energy 2163 feet (0.36 NM) long. It would therefore be impossible for it to separate storm cells that are 2163 feet or less apart, and so where these are within 2163 feet of each other the system would merge them together to produce a single storm cell on the indicator.
Azimuth Resolution. A weather radar system's azimuth resolution is its ability to separate adjacent targets at the same range but a few degrees apart (figure 18).
Azimuth resolution is a function of the transmitted beam width, which spreads from the aircraft as range increases. Storm cells that are separated by a distance less than the width of the beam at a given range will appear as one target on the indicator. Therefore, the narrower the beam width, and/or the closer the cell is to the aircraft, the better the azimuth resolution will be. Table 2 shows the beam-width diameter at various ranges, based on an initial transmitted beam-width of the Sperry Primus 700 system which is 3.2°.
| Distance from Aircraft | Diameter of Beam Cross-section |
| (NM) | (NM) |
| 16.8 | |
| 11.2 | |
| 5.6 | |
| 1.4 |
TABLE 2 BEAM-WIDTH CROSS-SECTION VERSUS DISTANCE
Precipitation Properties
Another important factor in radar performance is its ability to detect the various forms of precipitation it may encounter, ie rain, wet or dry hail or snow. Each of these will absorb, reflect and let through various amounts of energy, based on their composition. Figure 19 shows the different levels of return the system may expect from various types of precipitation.
As shown in figure 19 the amount of return signal the system has to work with will vary depending on the type of precipitation. In addition, precipitation like wet hail or particularly heavy areas of precipitation reflect most of the transmitted energy, failing to let any through. This makes detecting storm cells behind these areas much harder to detect and some modern radars have introduced Path Attenuation Correction/Compensation (PAC) alert systems to overcome this.
PATH ATTENUATION CORRECTION/COMPENSATION (PAC)
PAC circuits adjust the returned signals to compensate for attenuation by areas of intervening precipitation. These circuits monitor the reflectivity level of the returned signal and, as a target is encountered, the threshold reflectivity level is adjusted to compensate the next return so there will be no loss in intensity of the displayed storm cells that occur behind the first one.
However, there are limits to the amount of available compensation. Where particularly heavy areas of precipitation are encountered, rather than try and compensate for it, the indicator will show a warning to the flight crew, telling them that returns from cells behind the first one are unreliable.
Transmitter Frequency
The transmitted frequency also has an effect on the ability of the radar to detect targets. As described above, two frequency bands are used for aircraft weather radar systems, X-band and C-band.
The X-band frequency range provides good resolution of targets, but does not exhibit the same penetrating capabilities as C-band because they are more susceptible to signal absorption and scattering from smaller raindrops. This makes the representation of storm cells appearing beyond intervening ones less reliable and so PAC was introduced. C-band has good penetration through most precipitation but does not have the resolution qualities of X-band.
The best way of comparing the frequency characteristics of both bands is to compare two systems made by the same manufacturer, in this case Collins Avionics.
The WXR-700X weather radar system operates at a frequency of 9.333 GHz. This X-band weather radar system provides a high-resolution display because of a smaller beam width and high frequency. However, the X-band system advantage of providing a good return signal from weather targets is also one of the disadvantages when the user of the system wishes to see areas beyond intervening weather targets.
Because much of the X~band signal is reflected back by precipitation targets, very little energy is left to reflect from more distant targets and so the X-band weather radar system will not reliably penetrate target cells without attenuation distortion occurring. However, they can detect precipitation targets at greater distances than a C-band system if no intervening precipitation is present.
X-band systems perform well as avoidance radar, but cannot be used for penetration into areas that exhibit severe rainfall. Therefore, the X-band system is best suited for airline operators that use the radar as an avoidance system. The typical X-band weather radar system operator uses the detection capability of the X-band system to determine the location of targets at a distance where the targets will pose no threat and can easily be avoided.
The WXR-700C system operates at a frequency of 5.44 GHz, and this C-band weather radar system provides a display with slightly less resolution than the equivalent X-band system, but provides more penetrating power. That is, the precipitation targets being detected will be slightly less reflective at C-band frequencies than at X-band frequencies. This factor allows more transmitted energy to travel through any intervening precipitation.
For this reason, airline operators that find it necessary to pass close to, or enter into, areas of detected precipitation prefer C-band weather radar systems. This type of operation is called coexistence, as opposed to the avoidance operation practised by X-band weather radar system users.
As you can see these factors have an influence on the performance of weather radar systems but some of these can be compensated for by electronic processing.
Sensitivity Time Control
The Sensitivity Time Control (STC) circuits have a similar function to the Automatic Gain Control (AGC) circuits in communication systems, ie their task is to maintain signal strength, independent of the storm cell range. As with any transmitted radio signal, once the transmitted pulses leaves the antenna, they are attenuated and the rate is related to the inverse square law, ie double the distance - quarter the power, which was covered in book 1.
 50 NMs 100 NMs
Fig. 20 USE OF STC
50 NMs 100 NMs
Fig. 20 USE OF STC
|
In the example in figure 28, the storm cell fills the transmitted beam at 100 NM range. If this storm cell were approached by a system without STC then the receiver would see the return signal increase in intensity by the inverse square law, ie as the distance is halved, the strength of the returned signal would increase by a factor of 4. If this were not compensated for, the displayed storm cell would become deceptively intense as the aircraft approached it and distant intense storm cells would be displayed as only light rainfall.
To compensate for this phenomena, when the transmitter 'fires', the STC begins to function, but is limited in most radar systems to the first 150 NM. In the first few microseconds after transmission, the STC limits the receiver sensitivity, ie gain. However, as time goes on it gradually allows the receiver sensitivity to increase back up to its normal level so that at 150 NMs the STC cuts out completely (figure 21).
As shown in figure 21, the receiver gain is controlled so that it is limited for the returns of nearby storm cells and gradually increases as the returns from more distant storm cells are received. In effect, this means that storm cells of equal intensity but occurring at different ranges will appear the same on the CRT.
NORMAL RECEIVER GAIN LEVEL
 Fig. 21 STC FUNCTION
|
However, there are other factors that may cause the identical storm cells to appear differently, one of which we have discussed above, ie attenuation by intervening precipitation areas.
Long-Range Colour Enhancement
Some modern weather radar systems also use long-range colour enhancement circuits to compensate for the distance the storm cell occurs at, much like STC. However, STC is limited by the electrical capabilities of the receiver design, ie receiver sensitivity, and so STC reaches maximum compensation at approximately 150 NMs.
Systems equipped with long-range colour enhancement compensate for signal strength through adjustment of the threshold reflectivity levels used to decode the return signal strength. This adjustment provides a truer representation of weather targets that occur at longer ranges, but like the PAC circuits there is a limit to the amount of compensation, in order to maintain the distinction between reflectivity levels.
TROUBLE SHOOTING
As with most problems, the more information (symptoms) available about a defect, the easier it is locating (and rectifying) the fault or faults. Many of the reported defects about a weather radar will manifest themselves as a complete LRU failure or faulty information displayed on the indicator.
With most systems, a faulty CRT is rare, especially with EFIS systems where lots of other information is also shown on the ND. However, the CRT is the best window into the system and should be observed closely to help identify problem areas.
The flight crew should give as much detail about a problem as possible to the ground engineer when reporting problems. Typical areas of interest to an engineer will include:
* Is power on?
* Is power available to the radar system? (fuses, C/Bs, open circuits etc).
* Are there any warning annunciations?
* Does the problem occur on both systems, if fitted, or when using either controller?
* Does the self-test pattern display look OK?
* Is the fault altitude related?
* What indications are still present on the indicator?
These questions are hardly exhaustive, but this information, tied in with the CRT observations, assuming that it is working properly, will help you in your diagnosis.
Occasionally the problem is not within any of the units of the weather radar system, but in its installation. All LRUs except for the CRT and controller are usually located outside the pressurised area of the aircraft and so the environment can have an influence. Corroded connectors, moisture contaminated wiring etc, improper grounding, power interruptions and worn connector pins can all account for problems in the system.
While these trouble shooting hints do not cover all possible problems, they do indicate information and trouble shooting clues to look for. More specific trouble shooting aids are given in the AMM (or FIM Fault Isolation Manual) for each aircraft or the workshop manual for each particular piece of equipment.
Don't forget to inspect the system visually for any obvious signs of damage.
20.6. Weather radar (WXR) В737.
Подробно рассматривается в [4] рекомендуемой литературы.
Purpose
The weather radar (WXR) system supplies these visual
indications:
· Weather conditions
· Windshear events
· Land contours.
Description
WXR operates on the same principle as an echo. The WXR system transmits radio frequency (RF) pulses in a 180 degree area forward of the airplane. Objects reflect the pulses back to the receiver. The receiver processes the return signal to show weather, terrain, and windshear events.
Display
The WXR returns show in four different colors on the navigation displays (ND). Colors of the indications give the crew information about the intensity of the returns.
Дата добавления: 2015-10-26; просмотров: 295 | Нарушение авторских прав
| <== предыдущая страница | | | следующая страница ==> |
| Состав типовой МНРЛС | | | System Outputs |