|
Читайте также: |
A step by step - and hopefully easy-to-follow - guide to creating a basic pie chart.
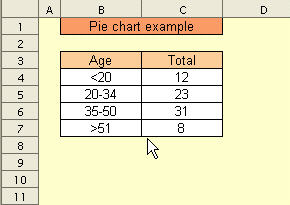
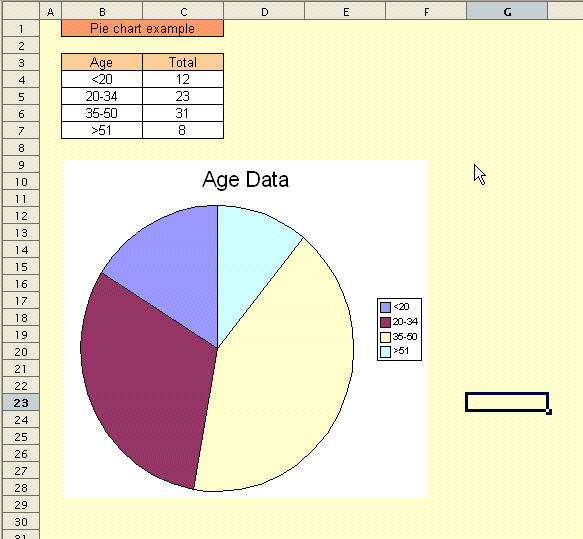
The table below is a good candidate for generating a pie-chart.
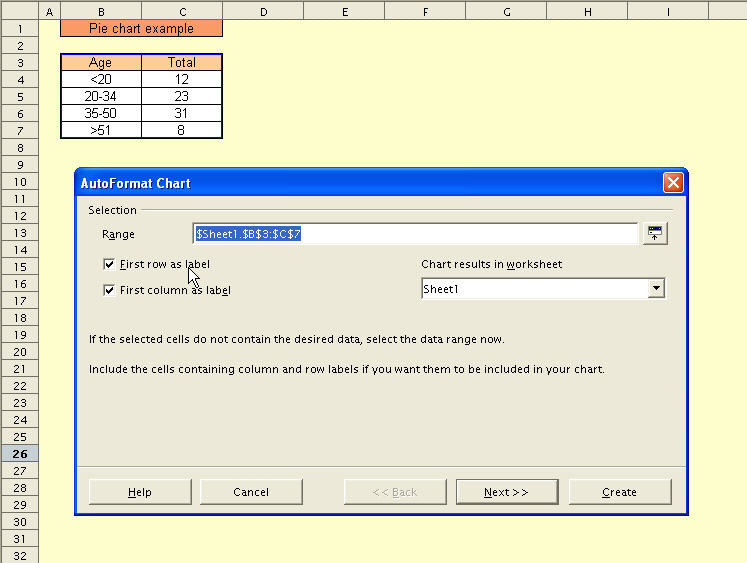
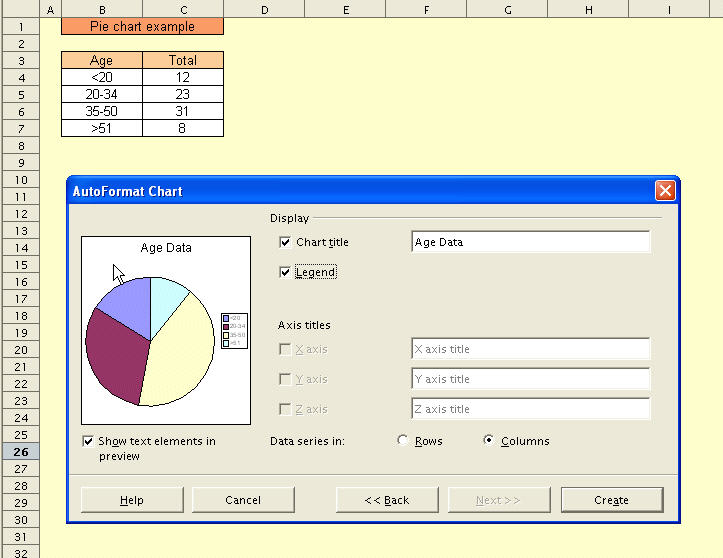
As before, we select Insert - Chart and the first Autoformat Chart dialog box appears. If you have not already selected the table, you can manually enter the range at this point.
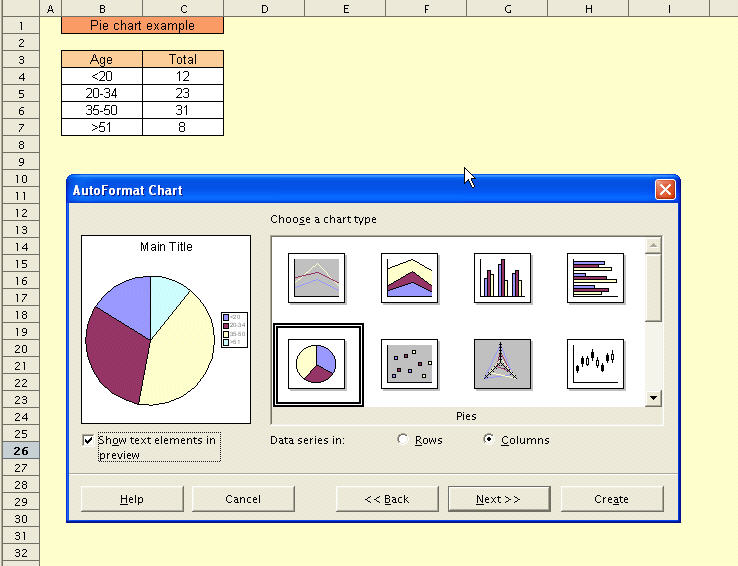
Once we select the pie-chart option, we get a small preview of the finished chart in the dialog box.
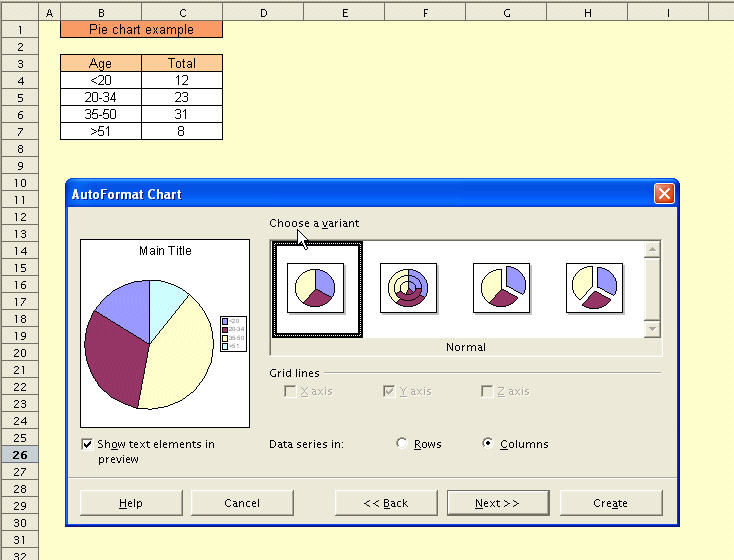
For pie-charts, there are four variants for us to choose from.
The next dialog window allows us to add a title to the pie-chart.
Our first pie-chart! It still needs cleaning up - but this will be covered in a later tip.
This entry was posted on Monday, November 22nd, 2004 at 9:09 pm and is filed underCharting. You can follow any responses to this entry through the RSS 2.0 feed. You canleave a response, or trackback from your own site.
One Response to “Charting: Pie charts”
1. Kristopher Says:
July 17th, 2007 at 5:17 pm
Did you ever post a followup with the cleanup in a subsequent tip? Specifically, I am looking to rearrange the pieces of the pie. I realize this can be done by changing the order of the data, but I was looking for another way. Essentially, the issue I have been having is that data legends overlap when several smaller pieces of the pie are positioned toward the upper right portion of the graph. If the pie could be rotated, those items would appear to the lower right where they would be readable again.
Thanks!
Дата добавления: 2015-08-03; просмотров: 67 | Нарушение авторских прав
| <== предыдущая страница | | | следующая страница ==> |
| Macros: Getting Cell Information | | | Database functions: DAVERAGE |