Студопедия
Случайная страница | ТОМ-1 | ТОМ-2 | ТОМ-3
АрхитектураБиологияГеографияДругоеИностранные языки
ИнформатикаИсторияКультураЛитератураМатематика
МедицинаМеханикаОбразованиеОхрана трудаПедагогика
ПолитикаПравоПрограммированиеПсихологияРелигия
СоциологияСпортСтроительствоФизикаФилософия
ФинансыХимияЭкологияЭкономикаЭлектроника

Charting: Editing charts : part 3

Advanced Functions: INDIRECT | Basic functions : SUBTOTAL | Filling a Cell Range with a Series | Basic Functions : CELL | Copying Formulas while preserving references | Data Validation 101 | Basic functions : SUMIF | Adding a background graphic | Using the Navigator | Introduction to the Status Bar |


Читайте также:
  1. Charting: Editing charts : part 2
  2. Charting: Pie charts

In this short tutorial, we will change the attributes of the chart title and the chart legend.


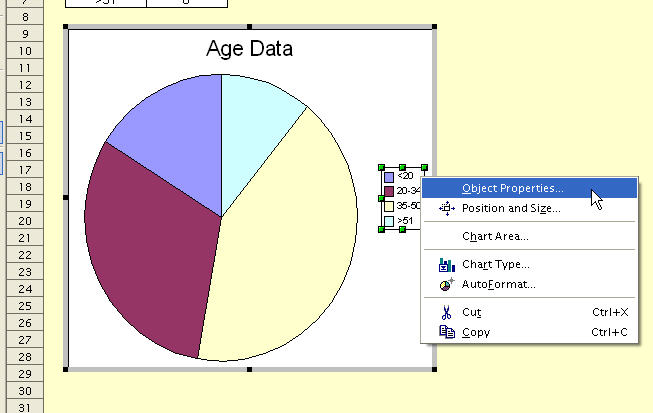
First, select the chart and go into Edit mode. Select the Legend object and click on Object properties as shown below.

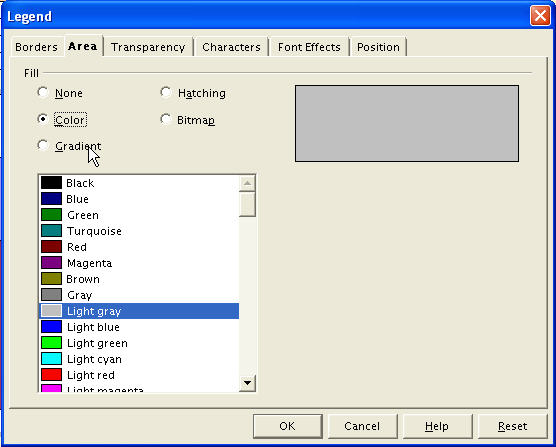
In the Object Proiperties dialog, select the Characters tab. We will increase the font size a few points.

In the Area tab, we will add some grey background fill.

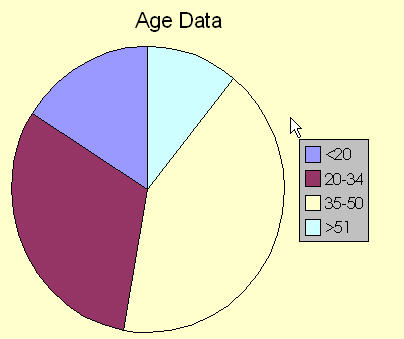
With the desired modifications complete, click OK to close the dialog. The modified chart is shown below.

This entry was posted on Saturda


Дата добавления: 2015-08-03; просмотров: 44 | Нарушение авторских прав


<== предыдущая страница | следующая страница ==>
Charting: Editing charts : part 2| Autocorrect

mybiblioteka.su - 2015-2024 год. (0.01 сек.)